Random Forest Regression

How much development signal hides in a satellite image?

0.22pooled out-of-fold R-squared
339out-of-fold predictions (all towns)
0.17std. dev. of R-squared across folds

Carlos Mendez

Nagoya University (GSID)

June 13, 2026

The Tension

Act I

Can a 64-number summary of a satellite photo tell you how a town is doing?

Bolivia has 339 municipalities. Many lack reliable survey data — yet every one of them is photographed from space.

A Google embedding model crushes each 2017 image into 64 numbers. Do those numbers know anything about human development?

Predictions cluster near the mean — the model knows the middle, not the edges

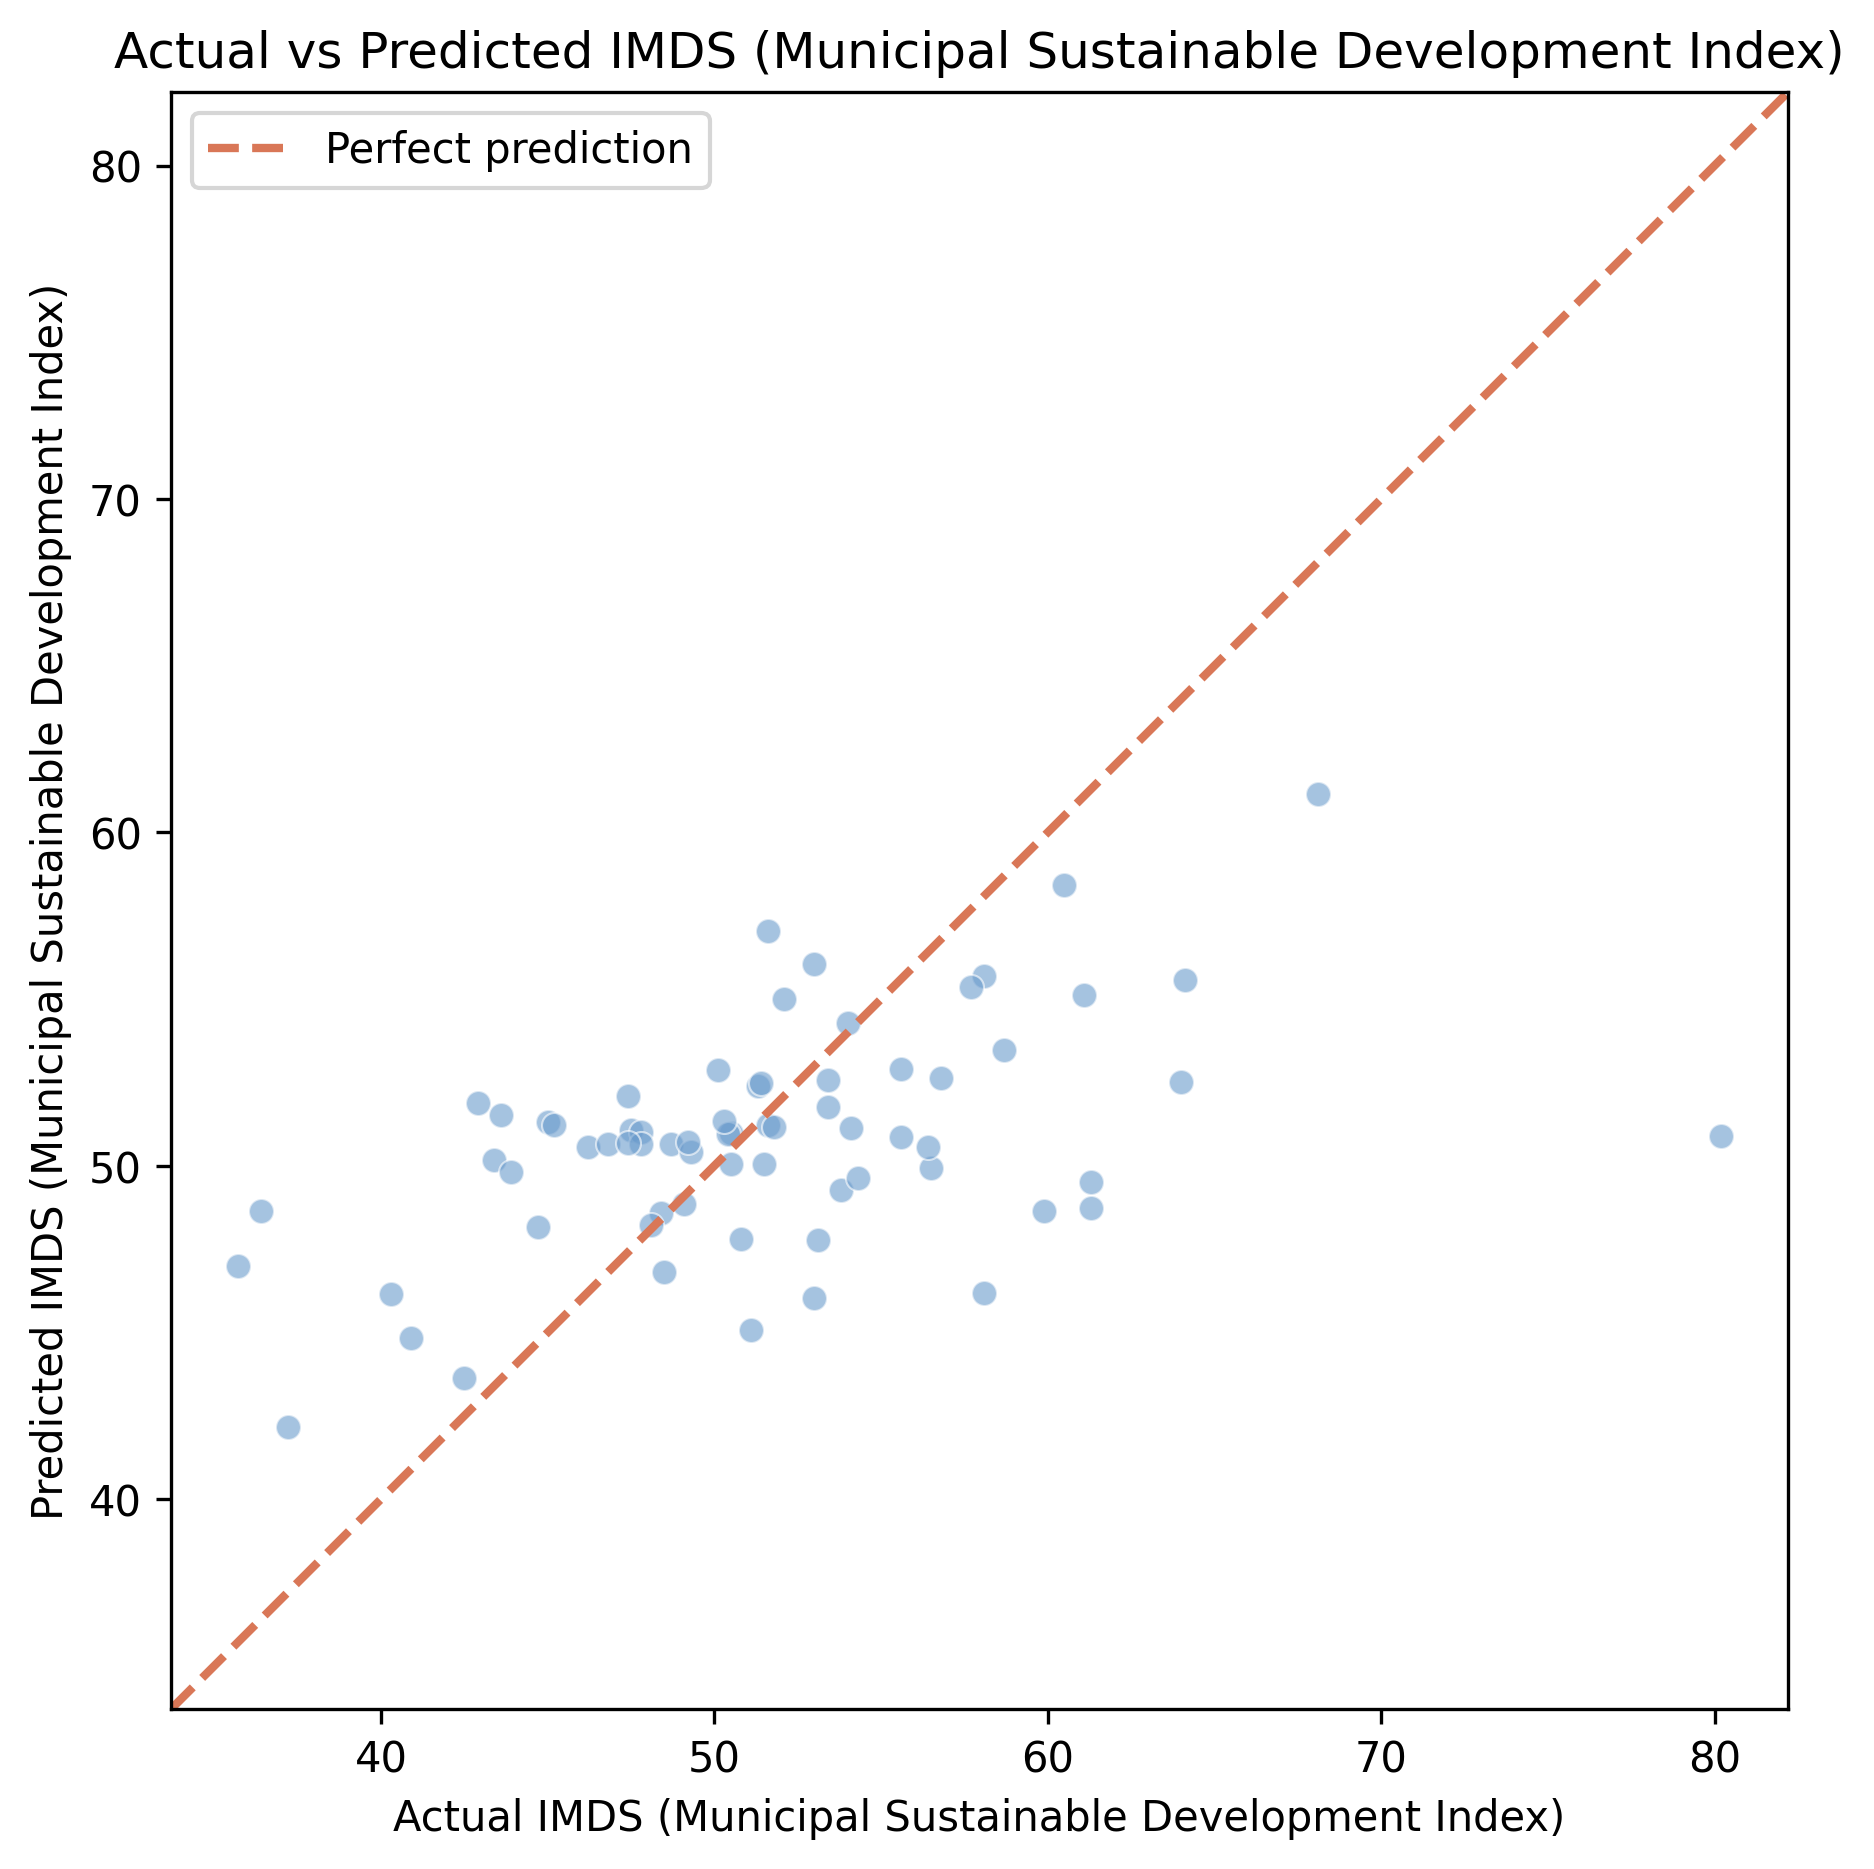
Out-of-fold predicted vs actual IMDS for all 339 municipalities, colored by cross-validation fold; the dashed line is perfect prediction.

Where we’re going

  • The data: 339 municipalities, a 0–100 development index, 64 image embeddings
  • Random Forest — bagging plus random feature subsets to fight overfitting
  • The honest protocol: 5-fold cross-validation with an out-of-fold prediction for every town
  • The lesson: report the spread, not just the mean — and the ceiling is the features, not the knobs

The Investigation

Act II

The target is tightly bunched: most towns score between 47 and 55

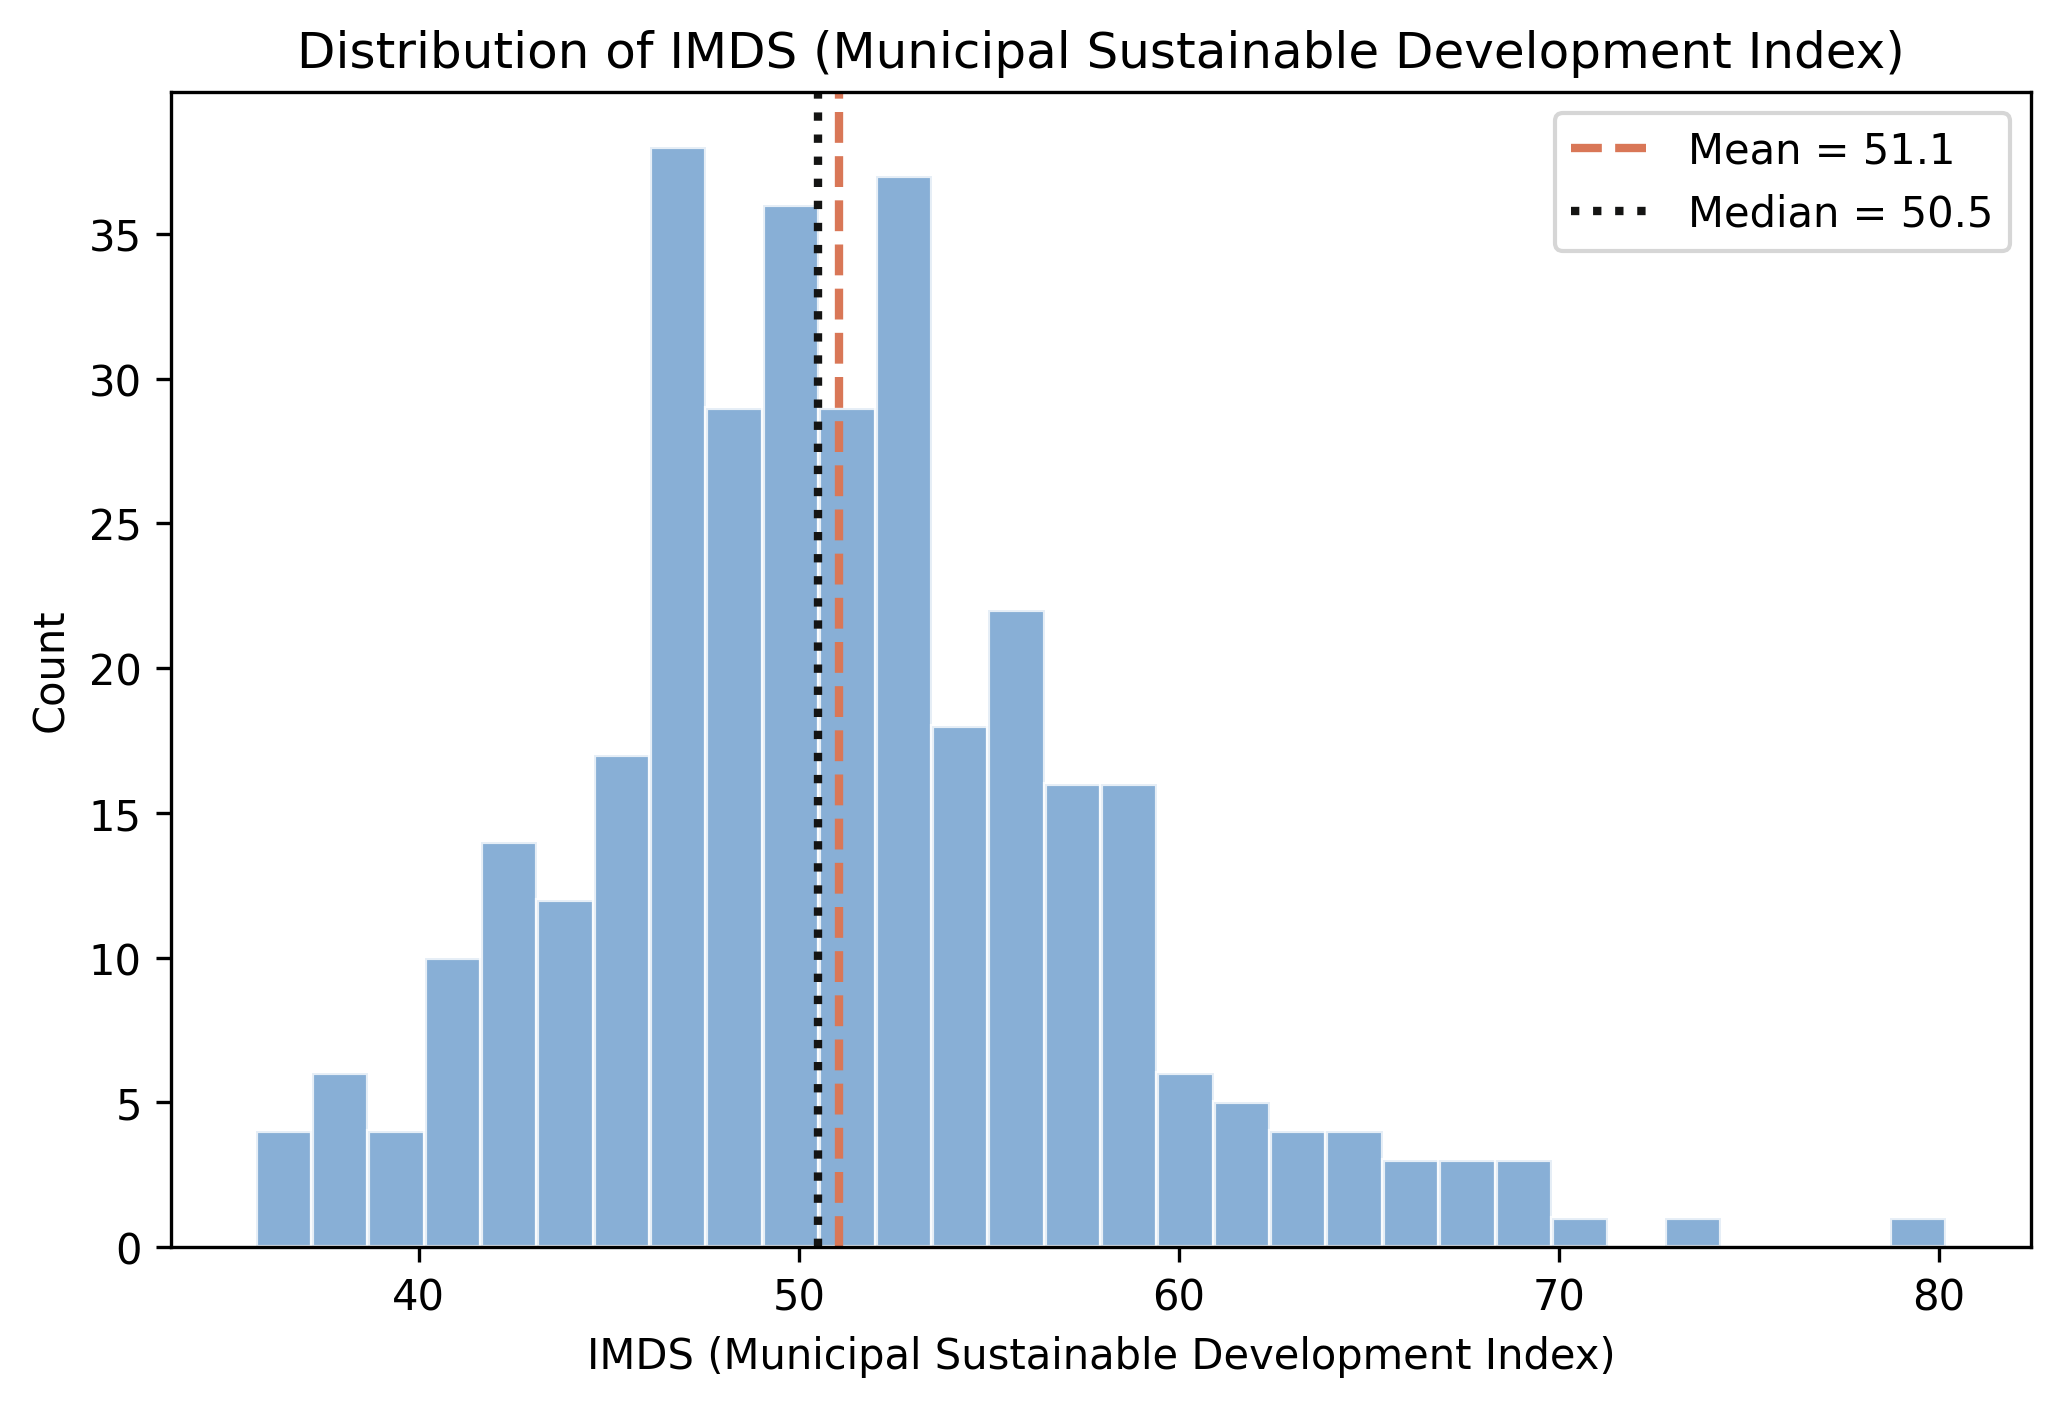
Distribution of IMDS across 339 municipalities; dashed = mean (51.1), dotted = median (50.5).

No single embedding is a smoking gun — the best correlation is only 0.37

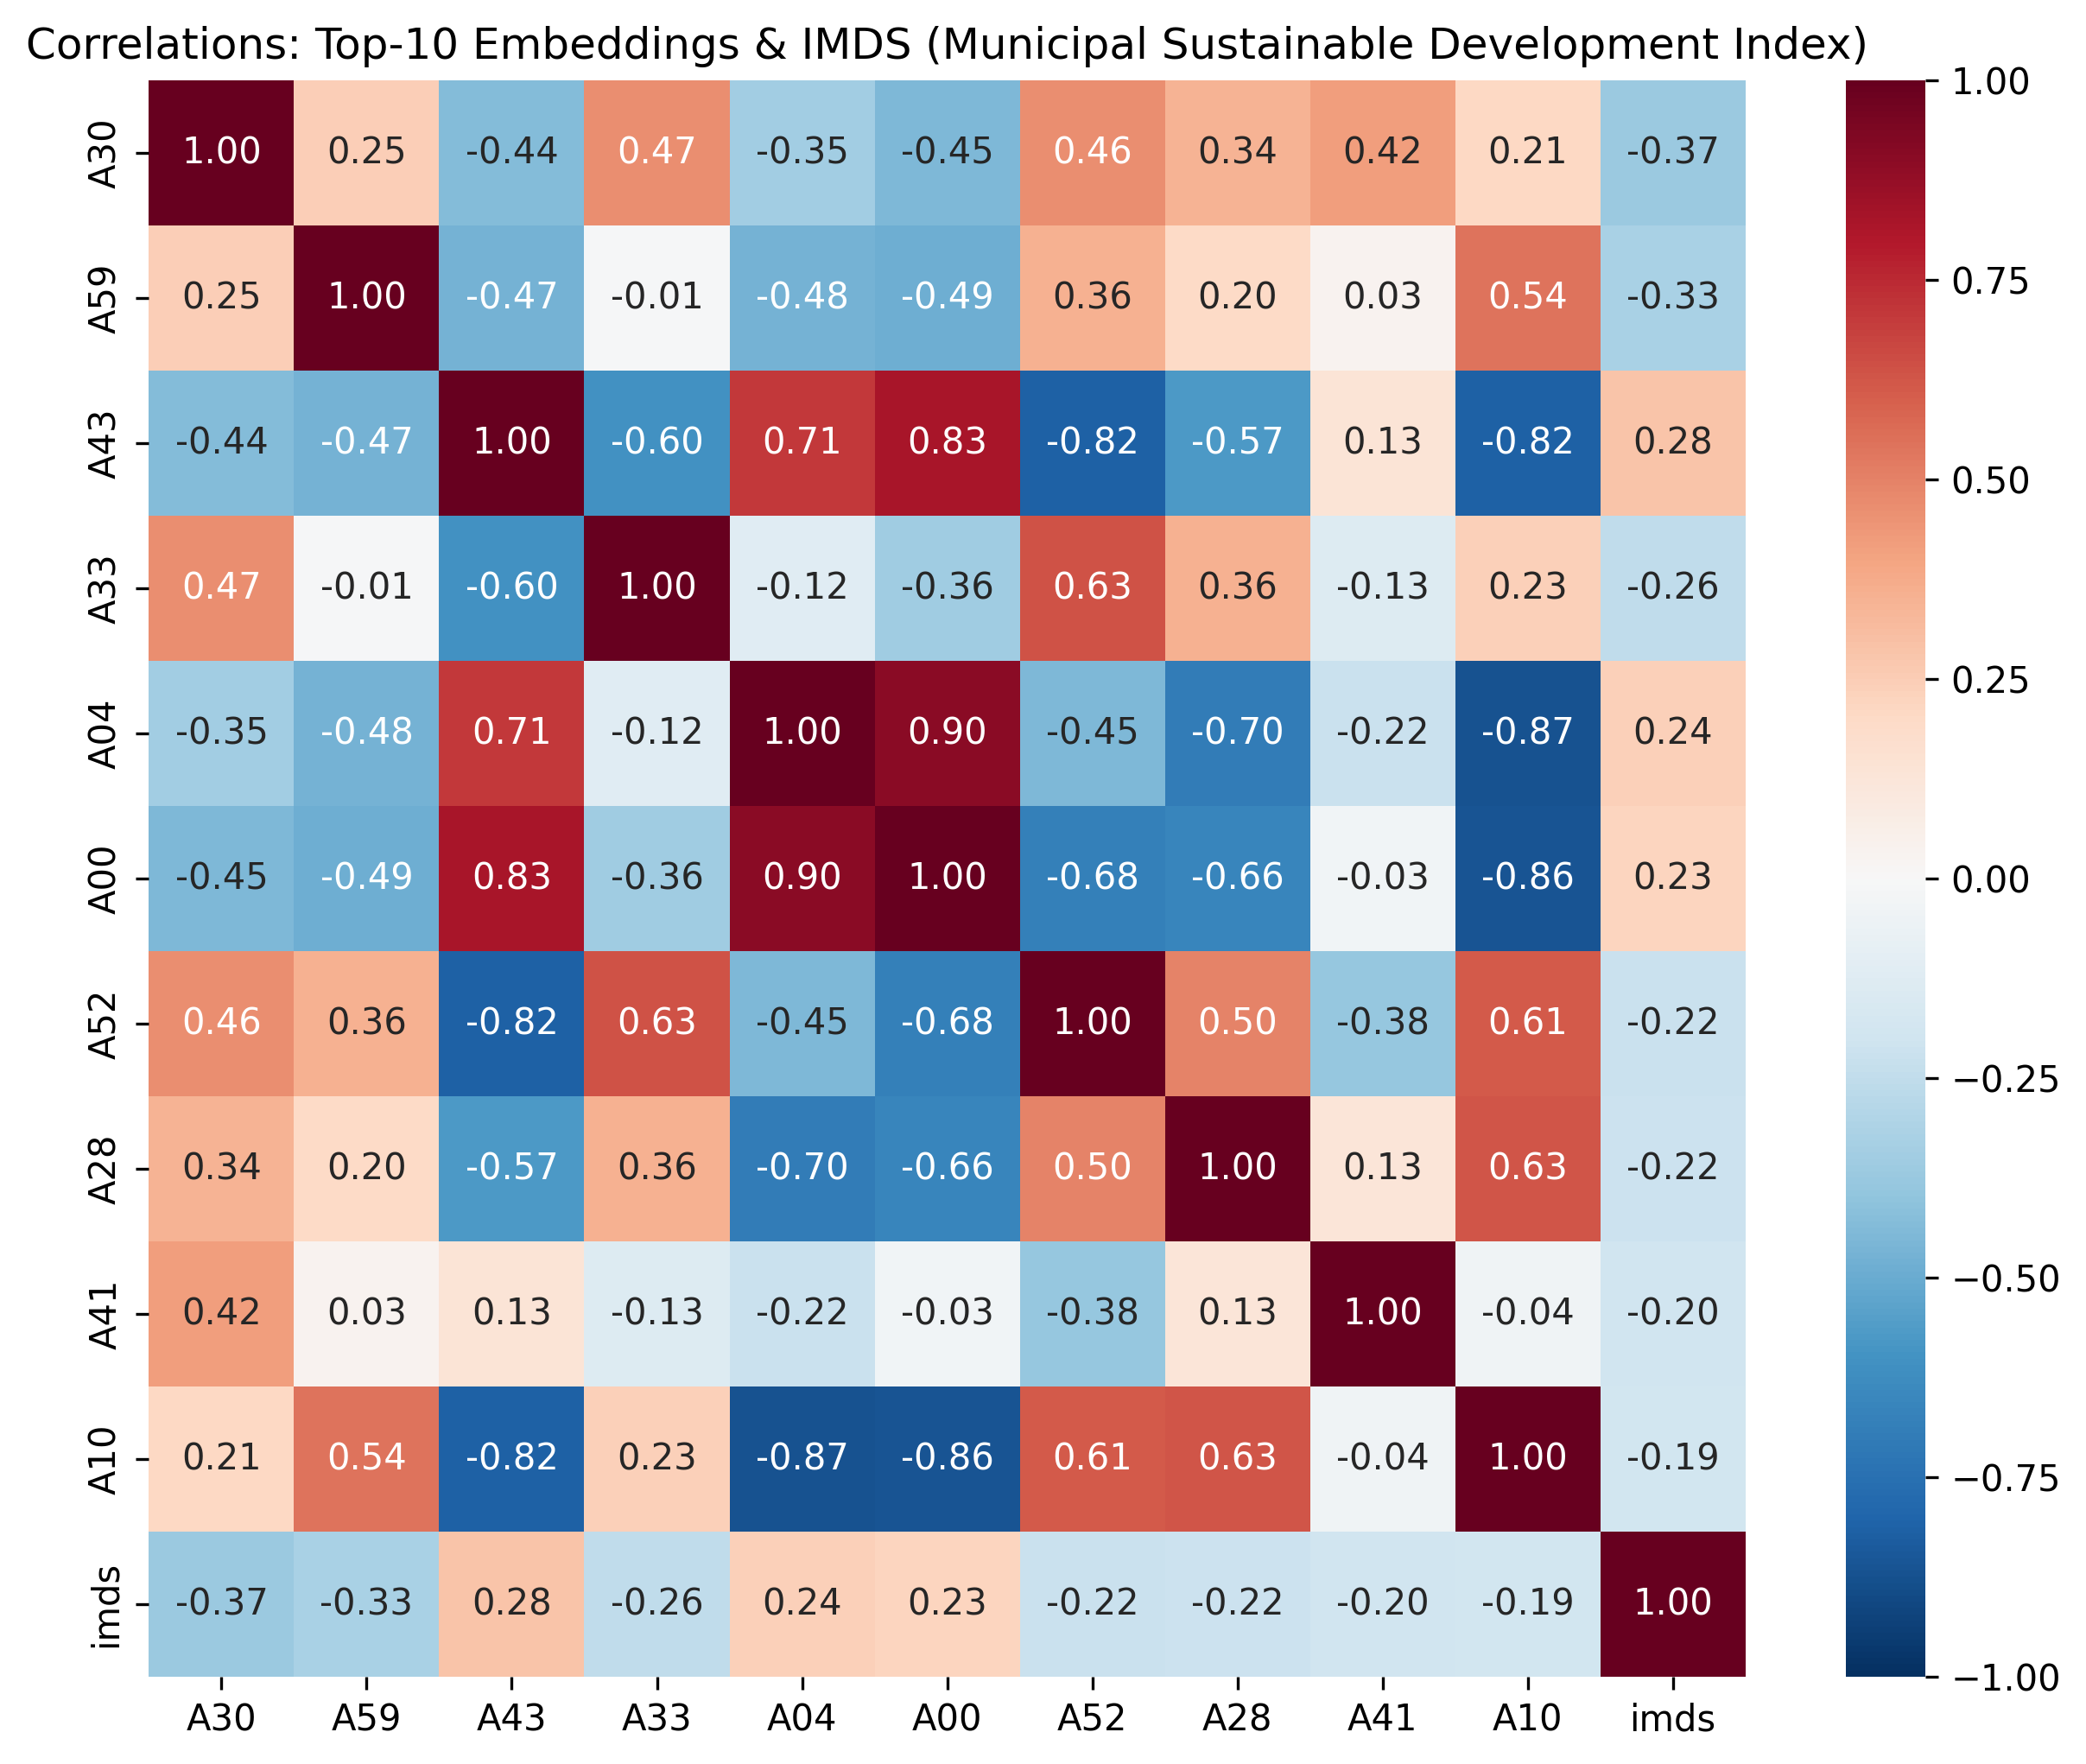
Correlation matrix: the ten embedding dimensions most correlated with IMDS.

A Random Forest averages many decorrelated trees to cut variance

\[\hat{y} = \frac{1}{B} \sum_{b=1}^{B} T_b(\mathbf{x})\]

Each tree \(T_b\) is grown on a bootstrap resample, and at every split only \(\sqrt{64}=8\) features are even considered.

Bootstrap rows + random feature subsets = trees that make different mistakes; averaging cancels the noise.

Don’t trust one split — rotate five, and predict every town out-of-fold

k-fold cross-validation

  • shuffle, cut into 5 folds
  • each fold is the test set once
  • train on 4, test on 1, rotate

Out-of-fold predictions

  • every town predicted exactly once
  • by a forest that never saw it
  • → honest predictions for all 339

A single 80/20 split is a lottery: across 200 random seeds the test R-squared ranges from −0.09 to 0.46 (Appendix A).

Five rotating exams: an honest score, plus the spread that one split hides

kf = KFold(n_splits=5, shuffle=True, random_state=42)
baseline_rf = RandomForestRegressor(n_estimators=100, random_state=42)

cv = cross_validate(baseline_rf, X, y, cv=kf,
        scoring=("r2", "neg_root_mean_squared_error", "neg_mean_absolute_error"))
# per-fold R²: [ 0.21  0.12  -0.03  0.45  0.37 ]
# mean R² = 0.224  ±  0.173

oof_pred = cross_val_predict(baseline_rf, X, y, cv=kf)  # one prediction / town
# pooled out-of-fold R² = 0.225

Fold 3 scores −0.03 — worse than guessing the average. One lucky split could have shown you only the 0.45.

Report the standard deviation: the model’s quality swings fold to fold

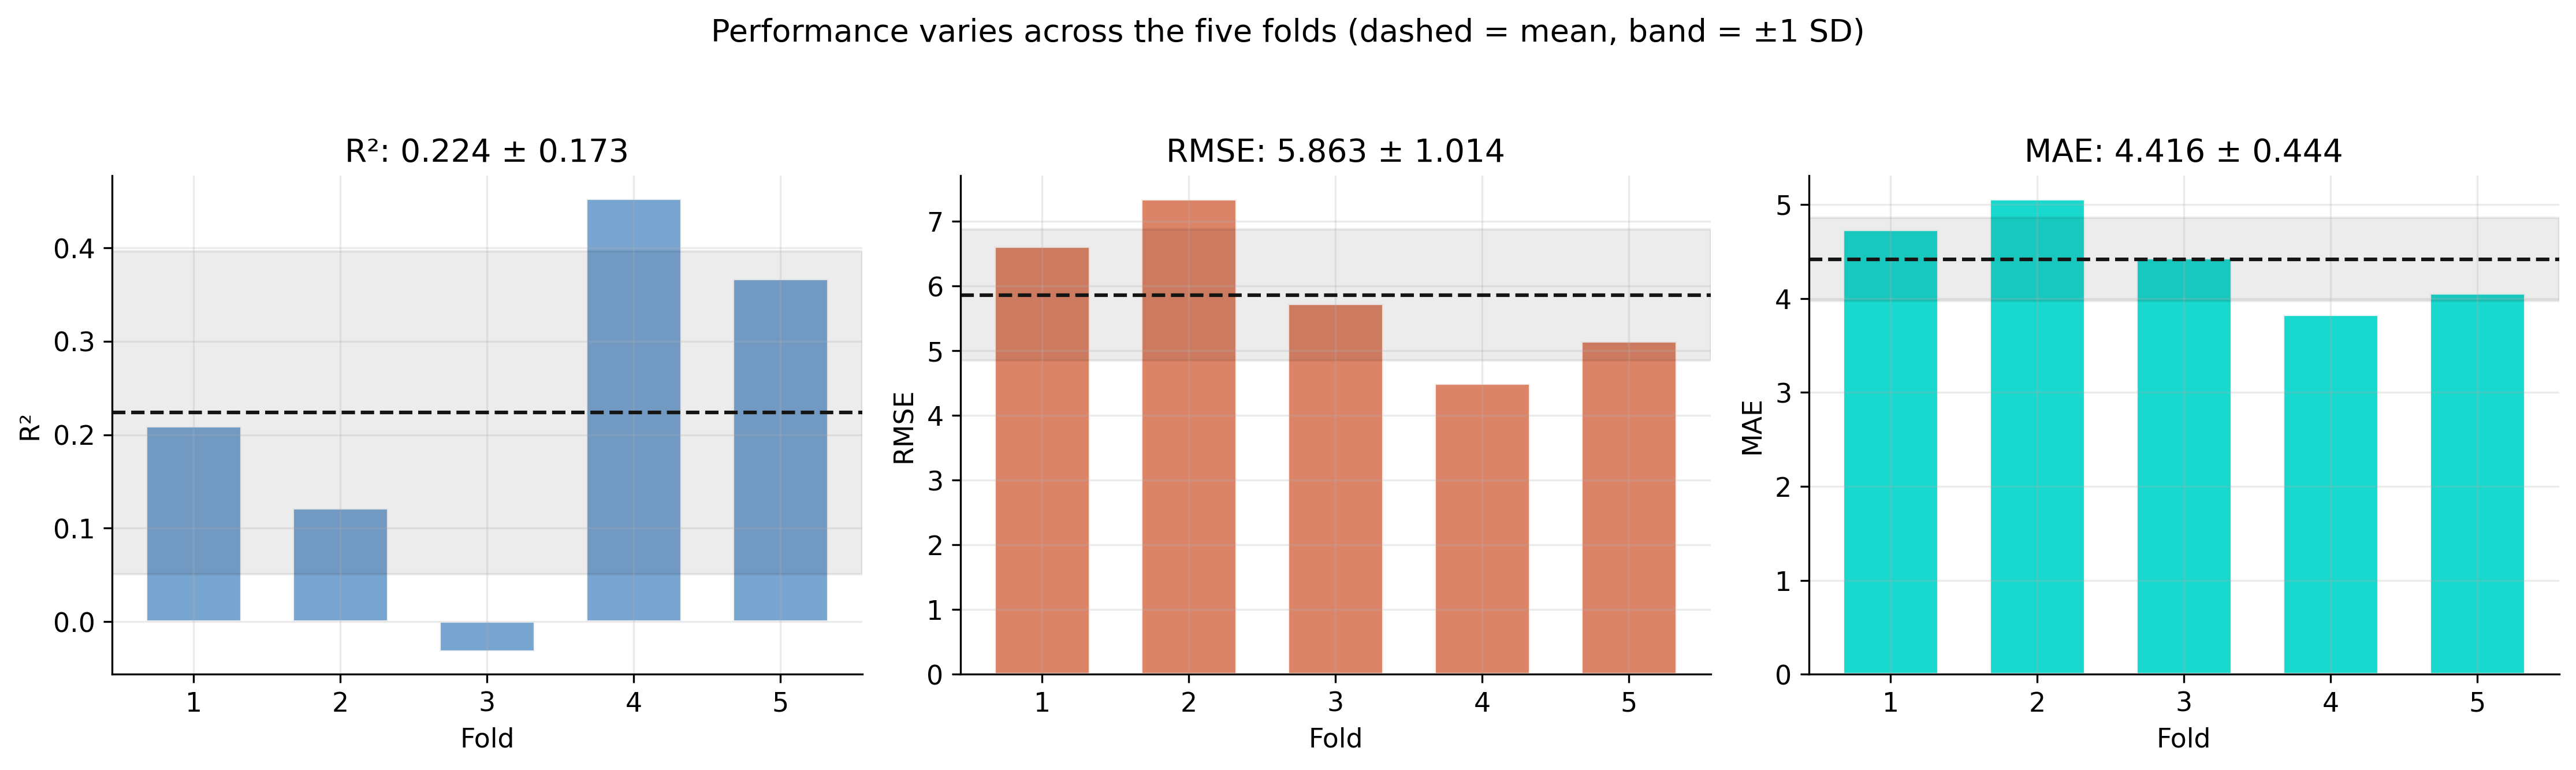
Per-fold R-squared, RMSE, and MAE; dashed line = mean, shaded band = ±1 standard deviation.

A30 carries the signal — shuffling it alone costs more R-squared than the model has

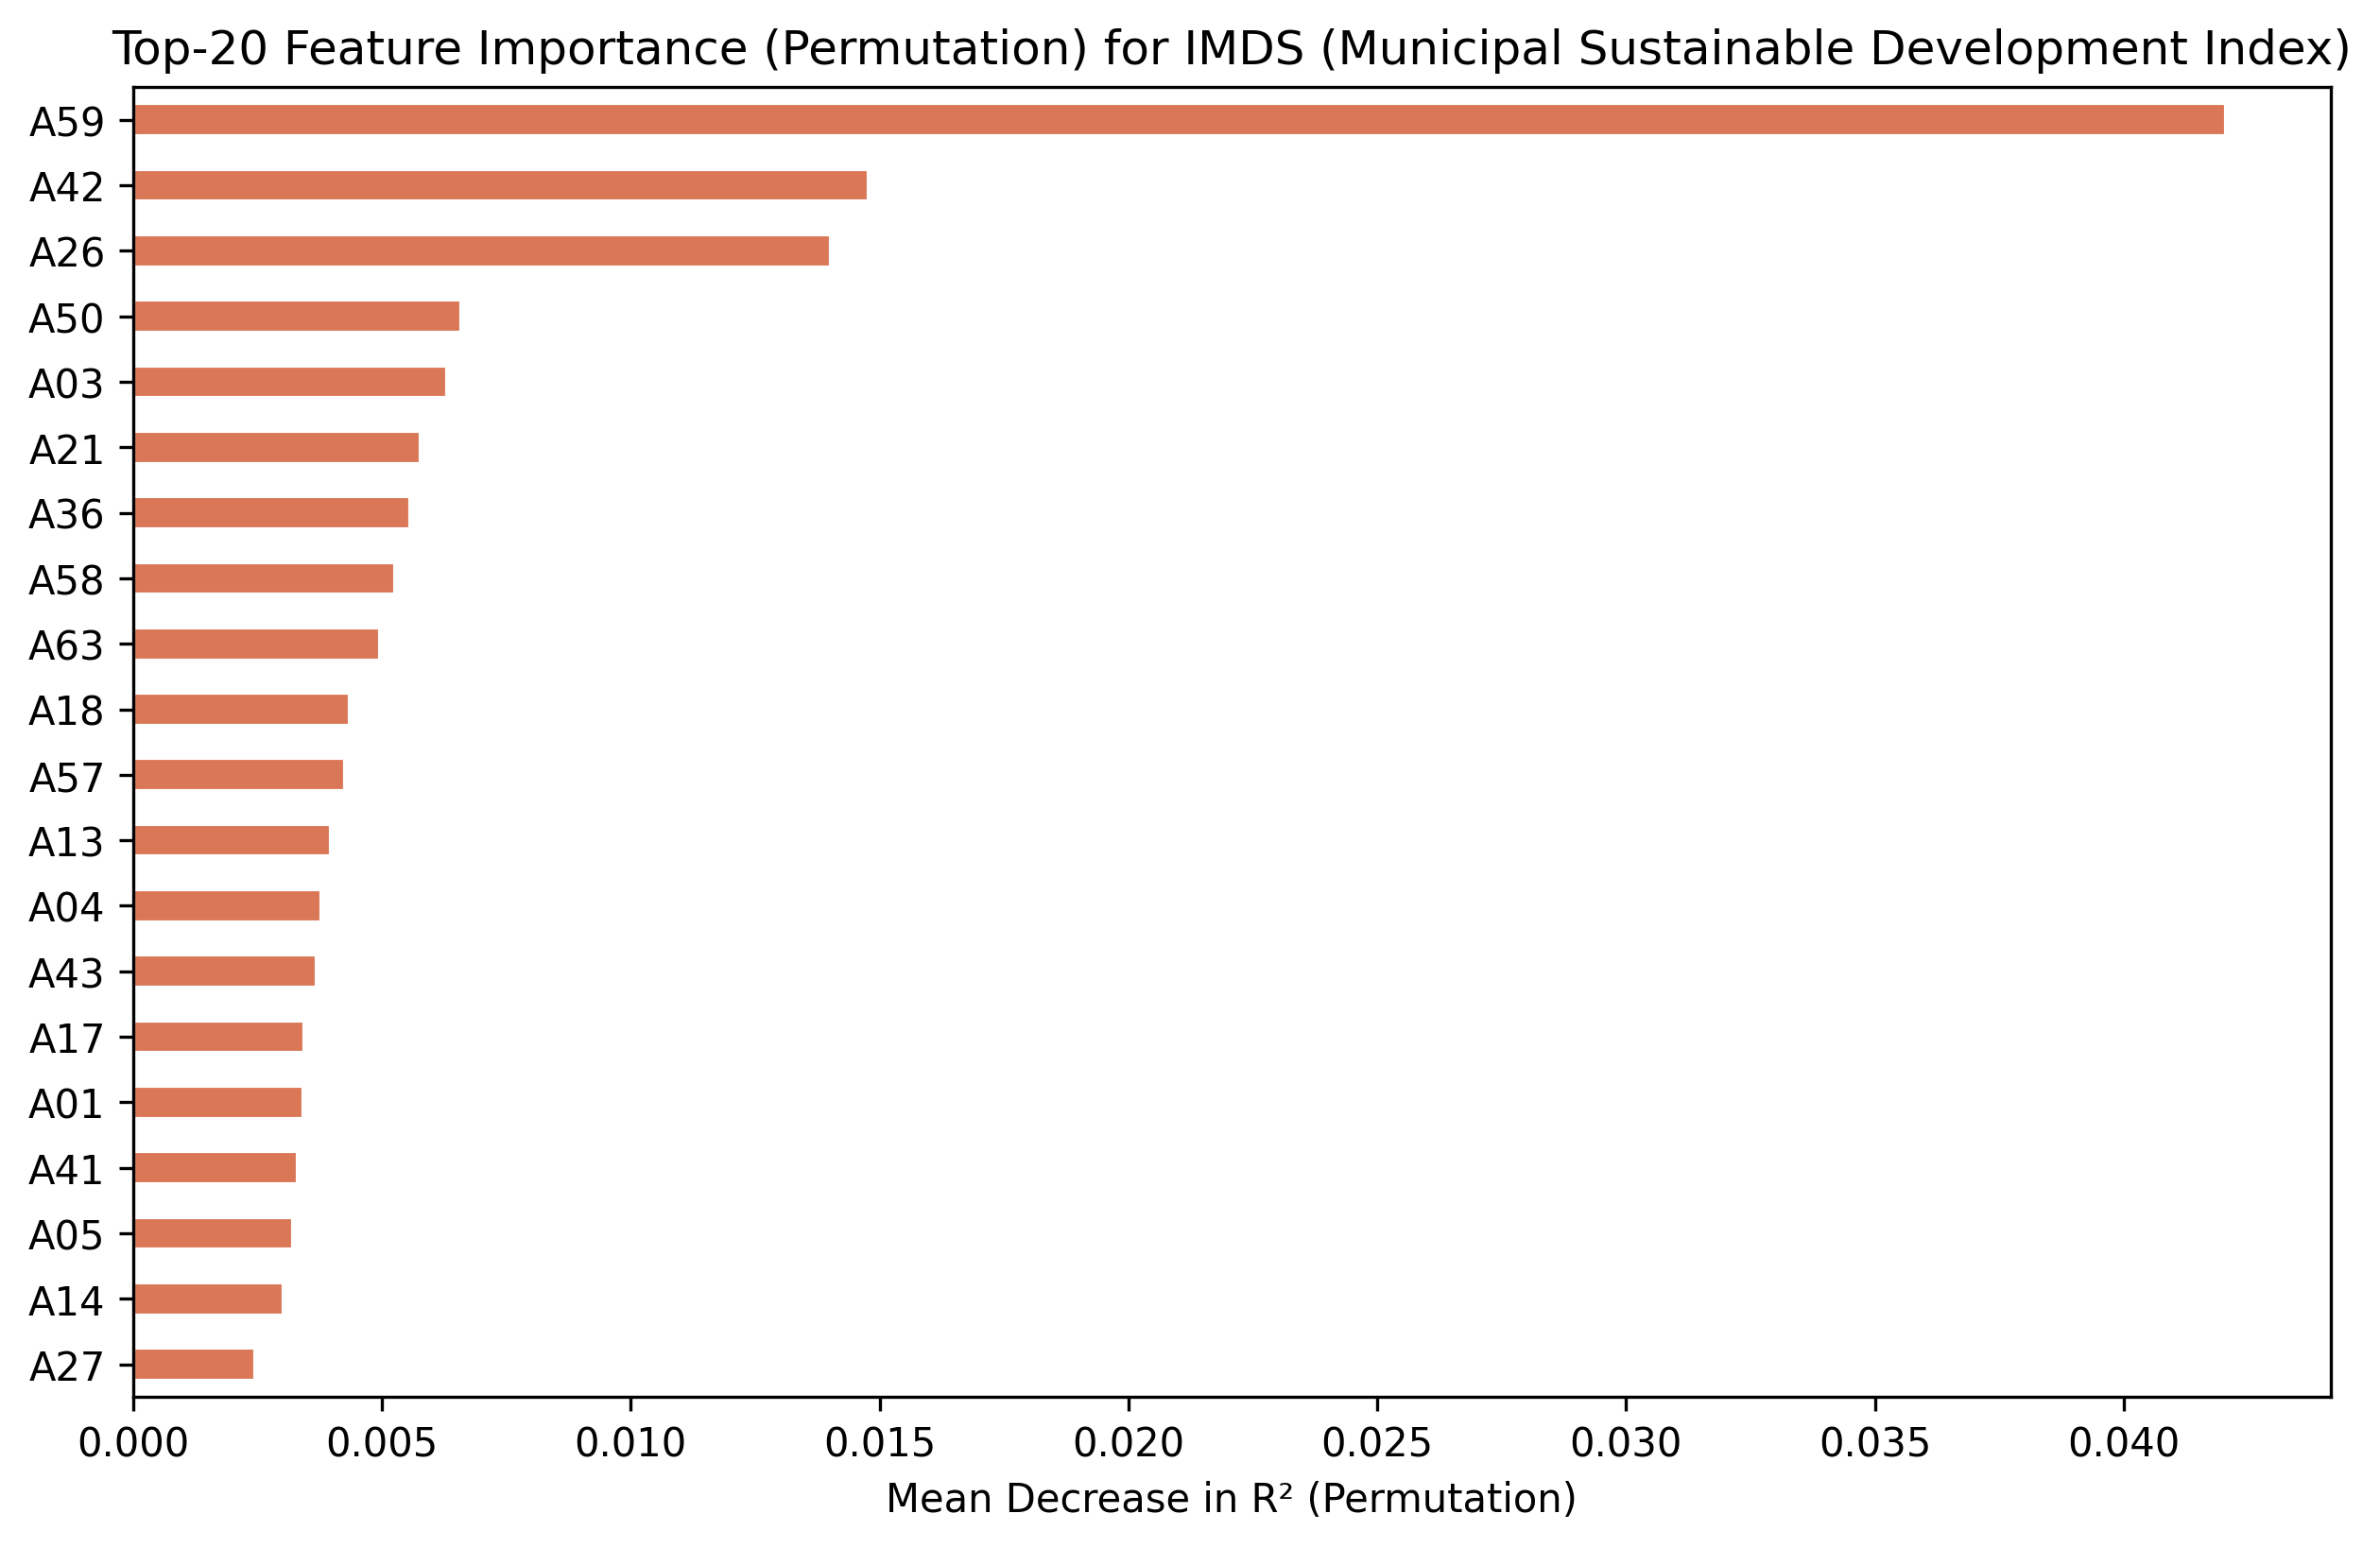
Top-20 embedding dimensions by permutation importance (drop in R-squared when a feature is shuffled).

MDI and permutation agree on A30 — and that agreement is reassuring

MDI (impurity)

  • built into the fitted model, free
  • A30 ≈ 12% of impurity reduction
  • biased toward high-cardinality features

Permutation

  • shuffles each feature, re-scores R²
  • A30 ≈ 0.25, then A59 ≈ 0.11
  • unbiased by scale or cardinality

Two very different methods crowning the same feature is evidence A30 is real signal, not a counting artifact.

The relationships are non-linear thresholds — which is why a tree beats a line

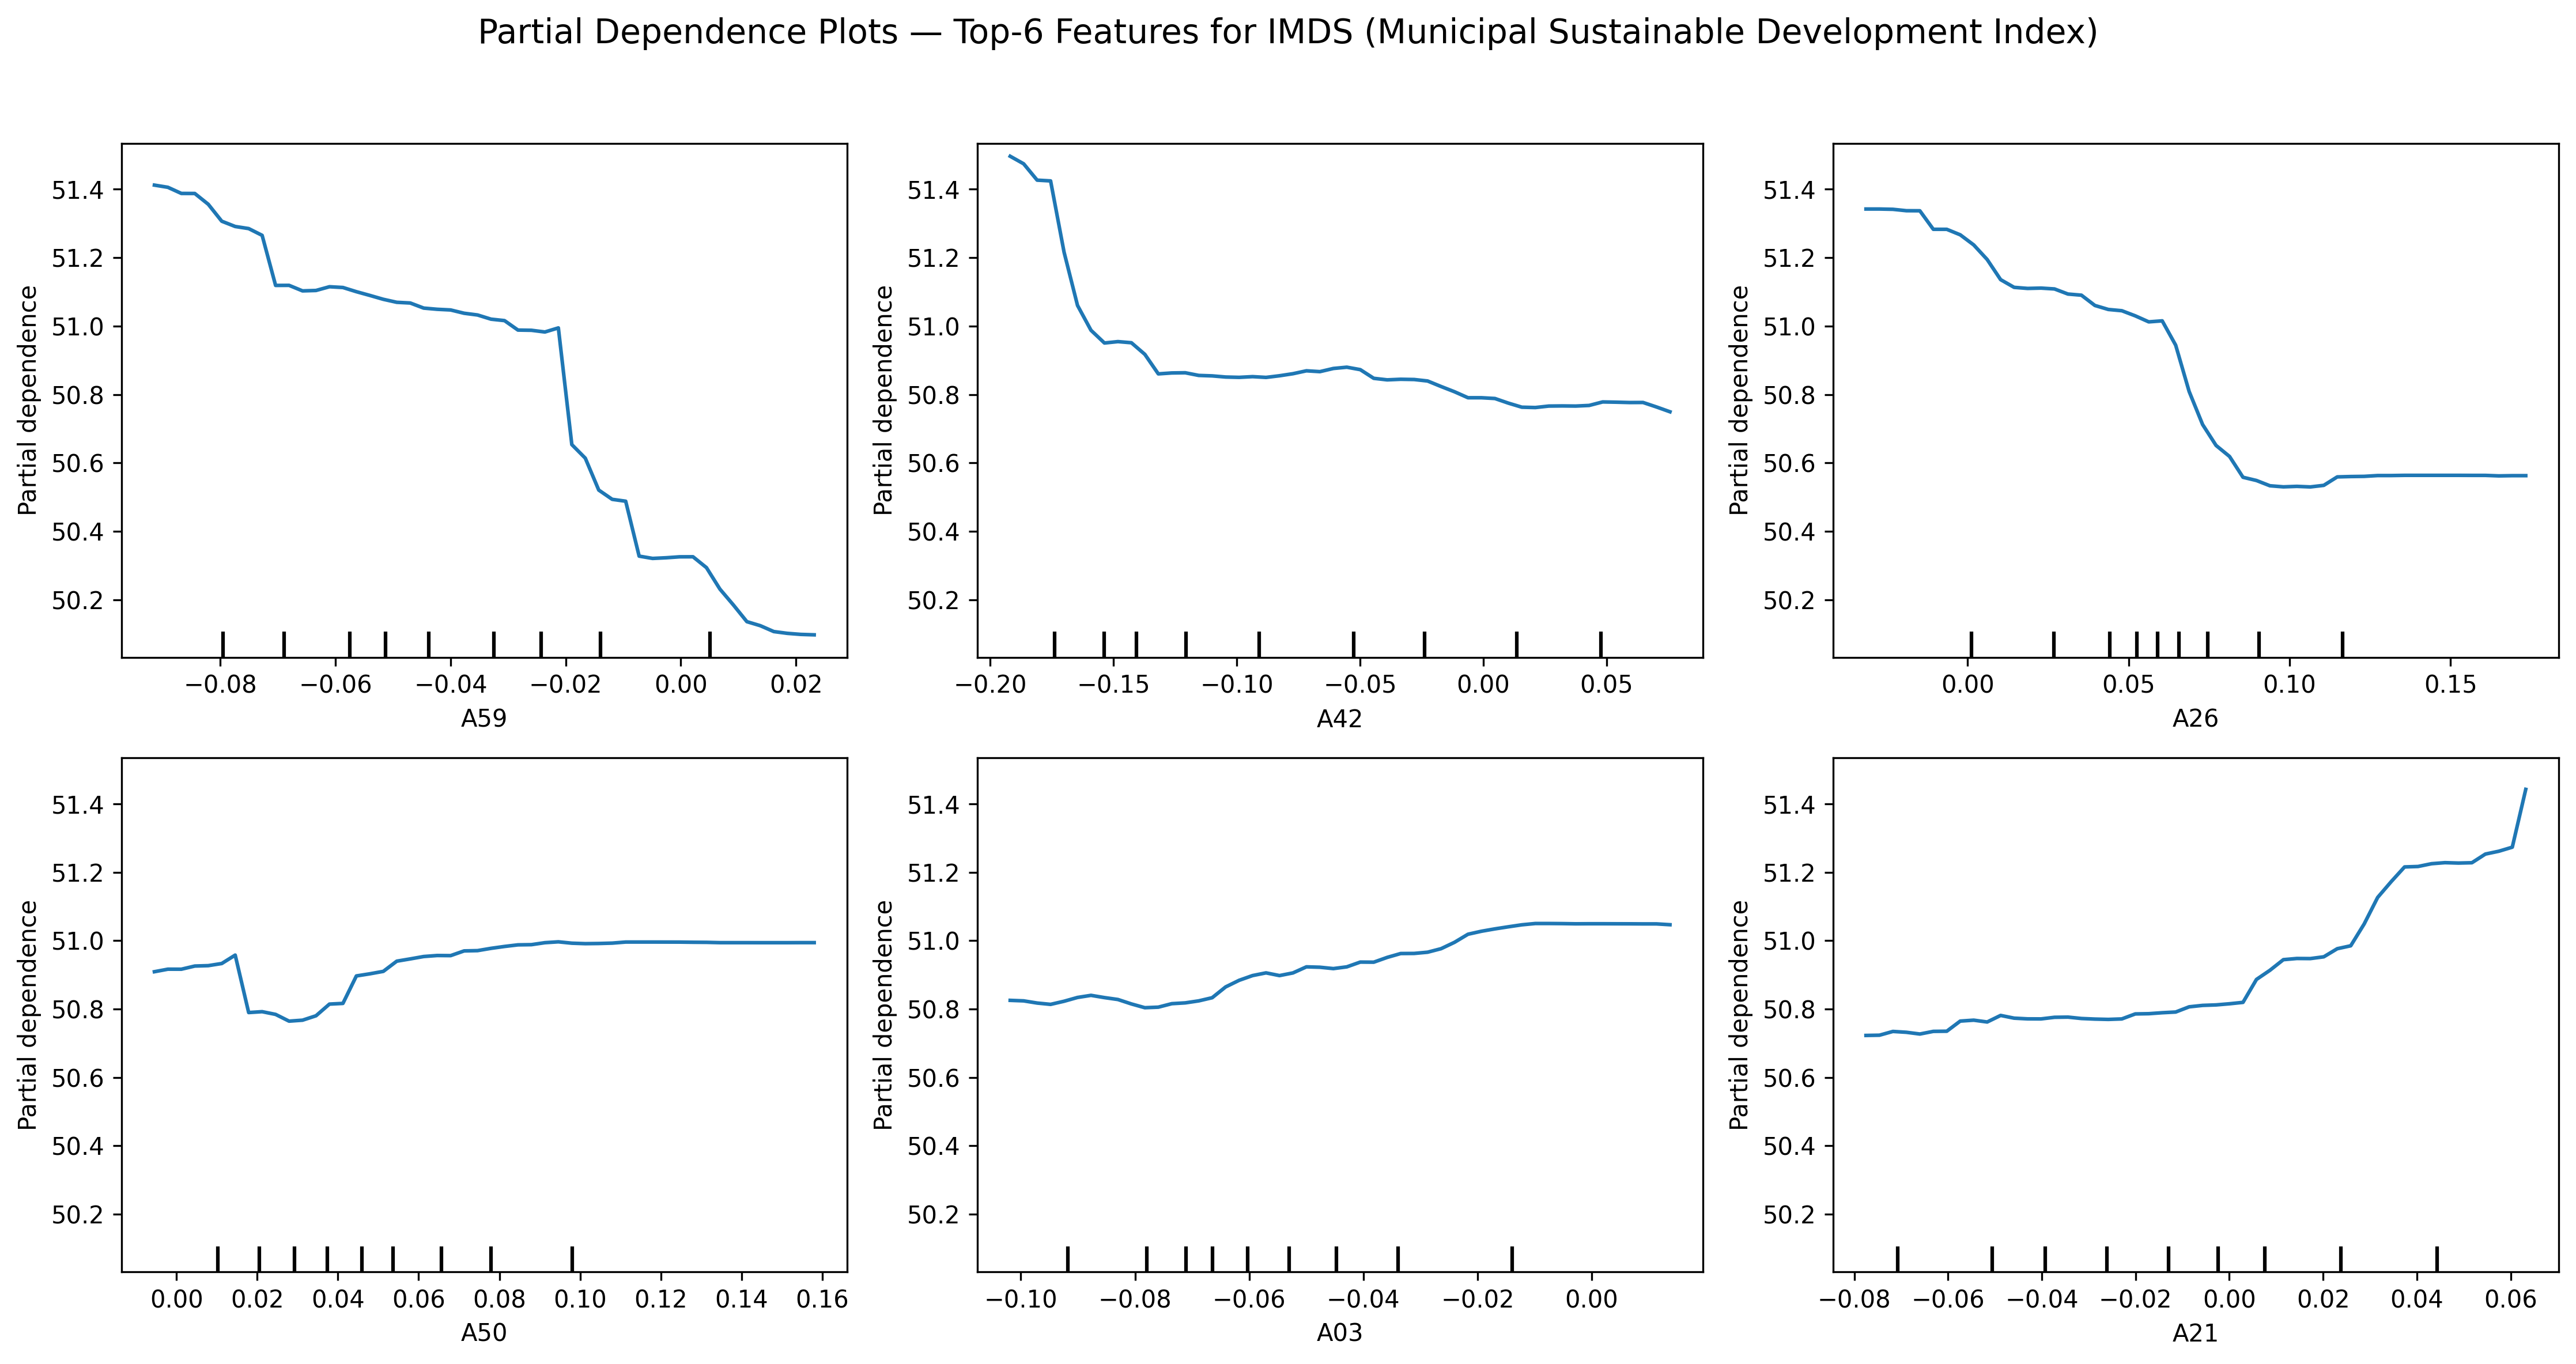
Partial dependence for the top-6 embeddings: sharp rises then plateaus, not straight lines.

The Resolution

Act III

Across all 339 towns the forest explains about 22% of the variation

0.22

pooled out-of-fold R-squared (per-fold 0.224 ± 0.173, RMSE 5.95, MAE 4.42)

Predictions match the center of the distribution — but only half its spread

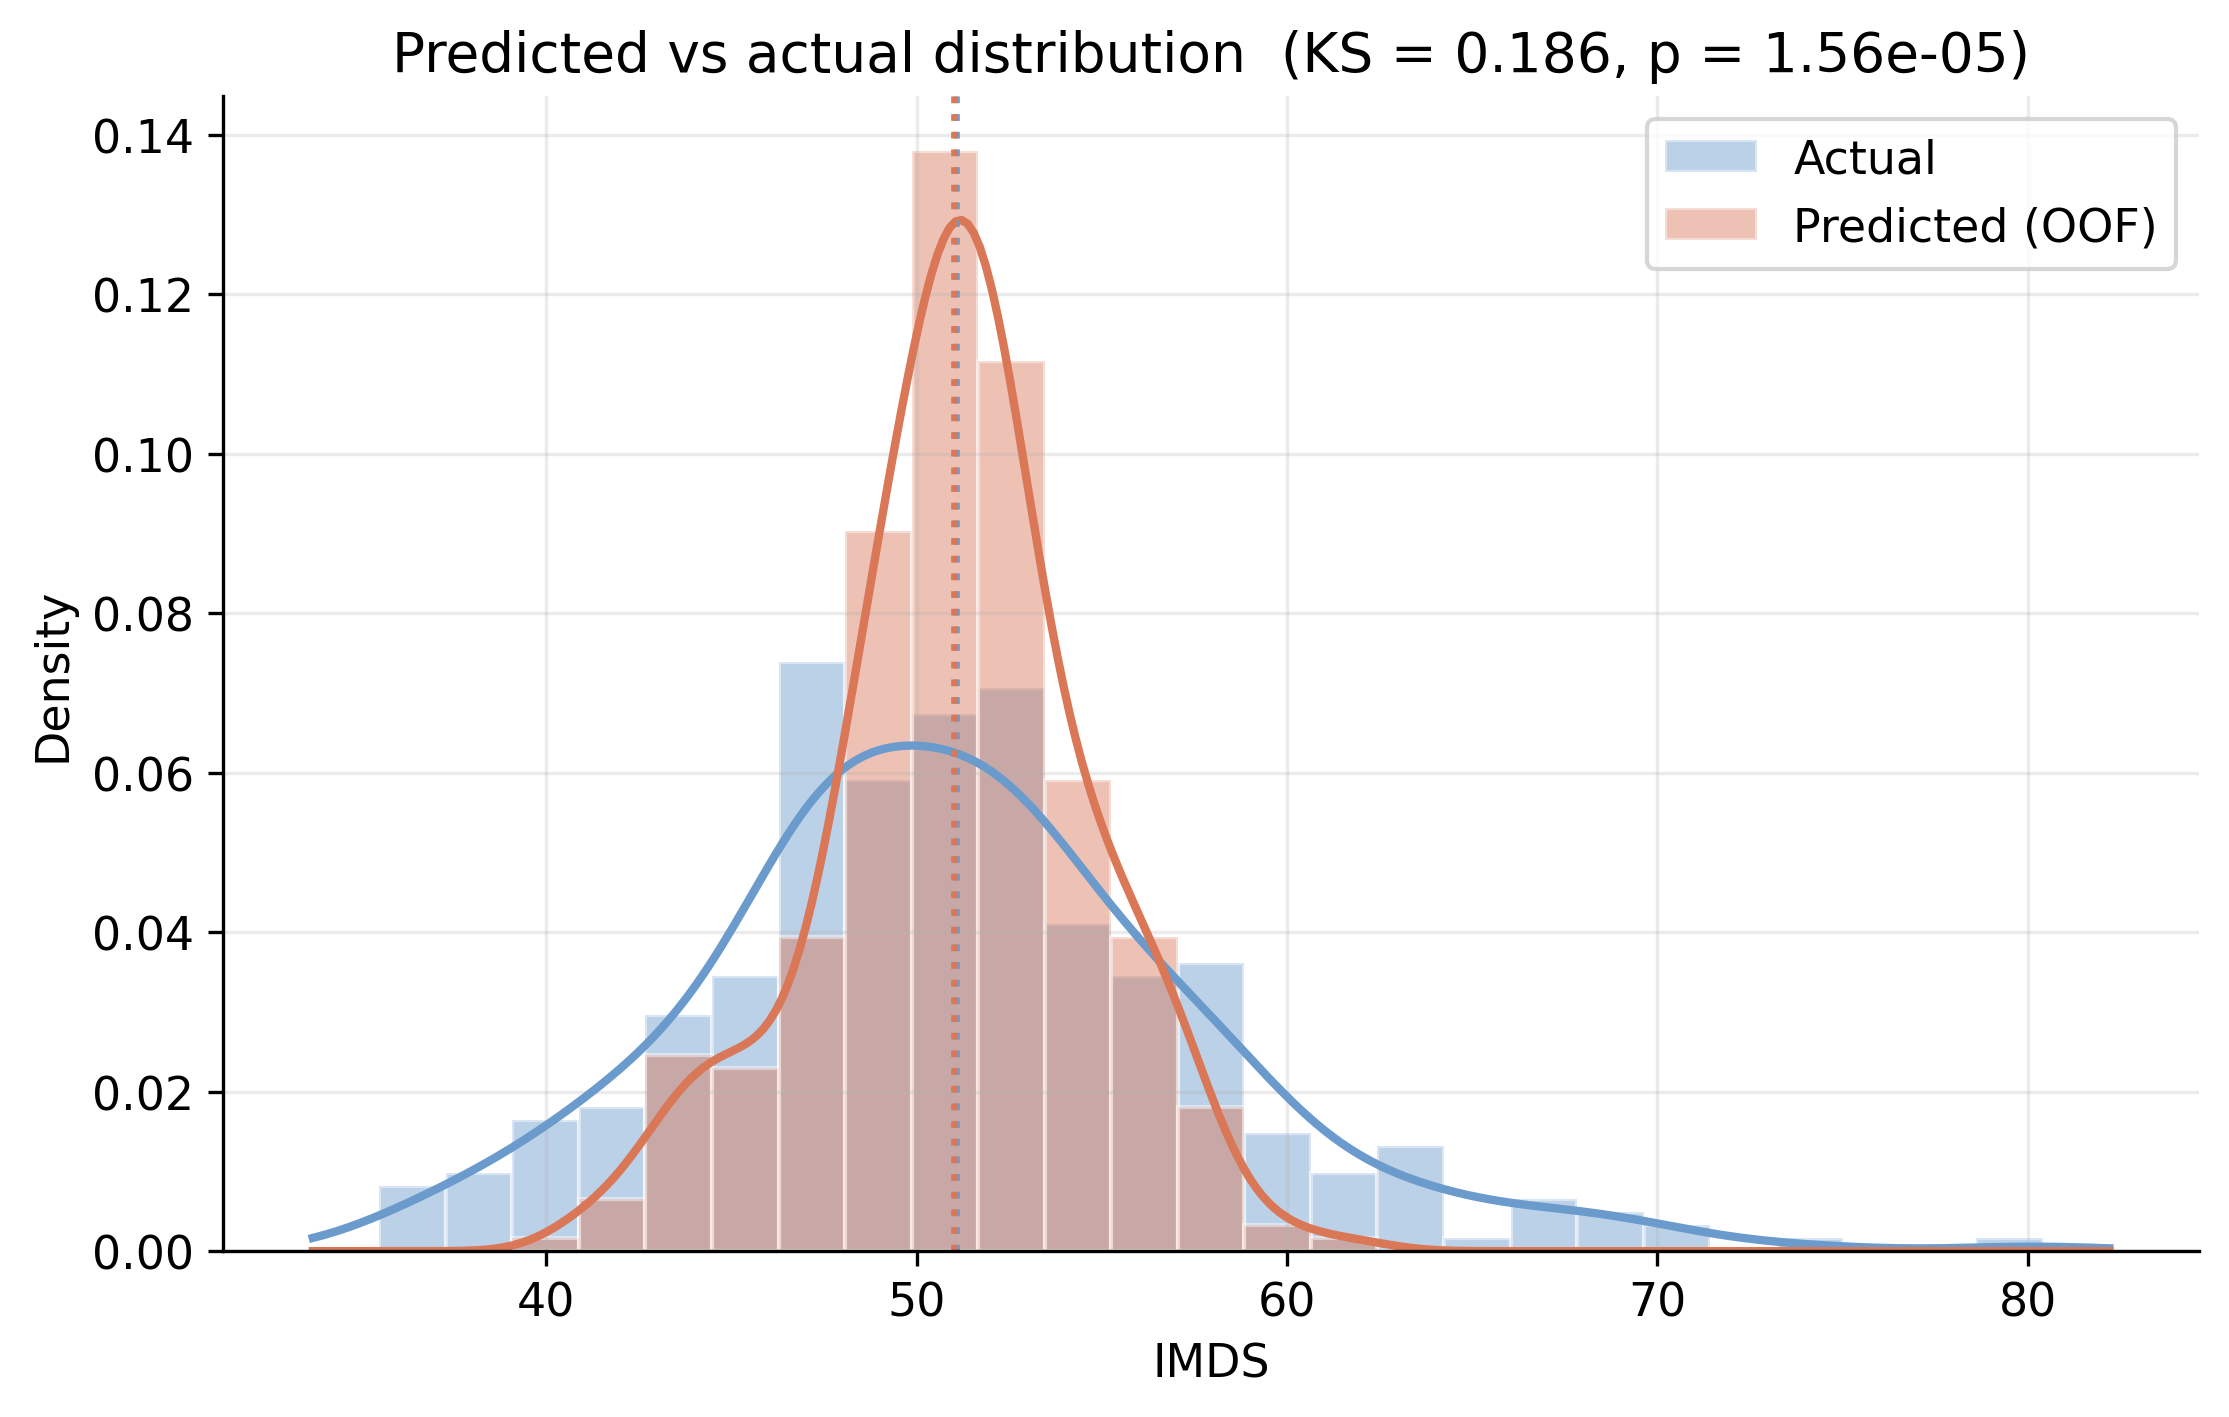
Density of actual IMDS vs out-of-fold predictions; a Kolmogorov–Smirnov test rejects equal distributions.

The model is typically off by 4.4 IMDS points — and worst at the high end

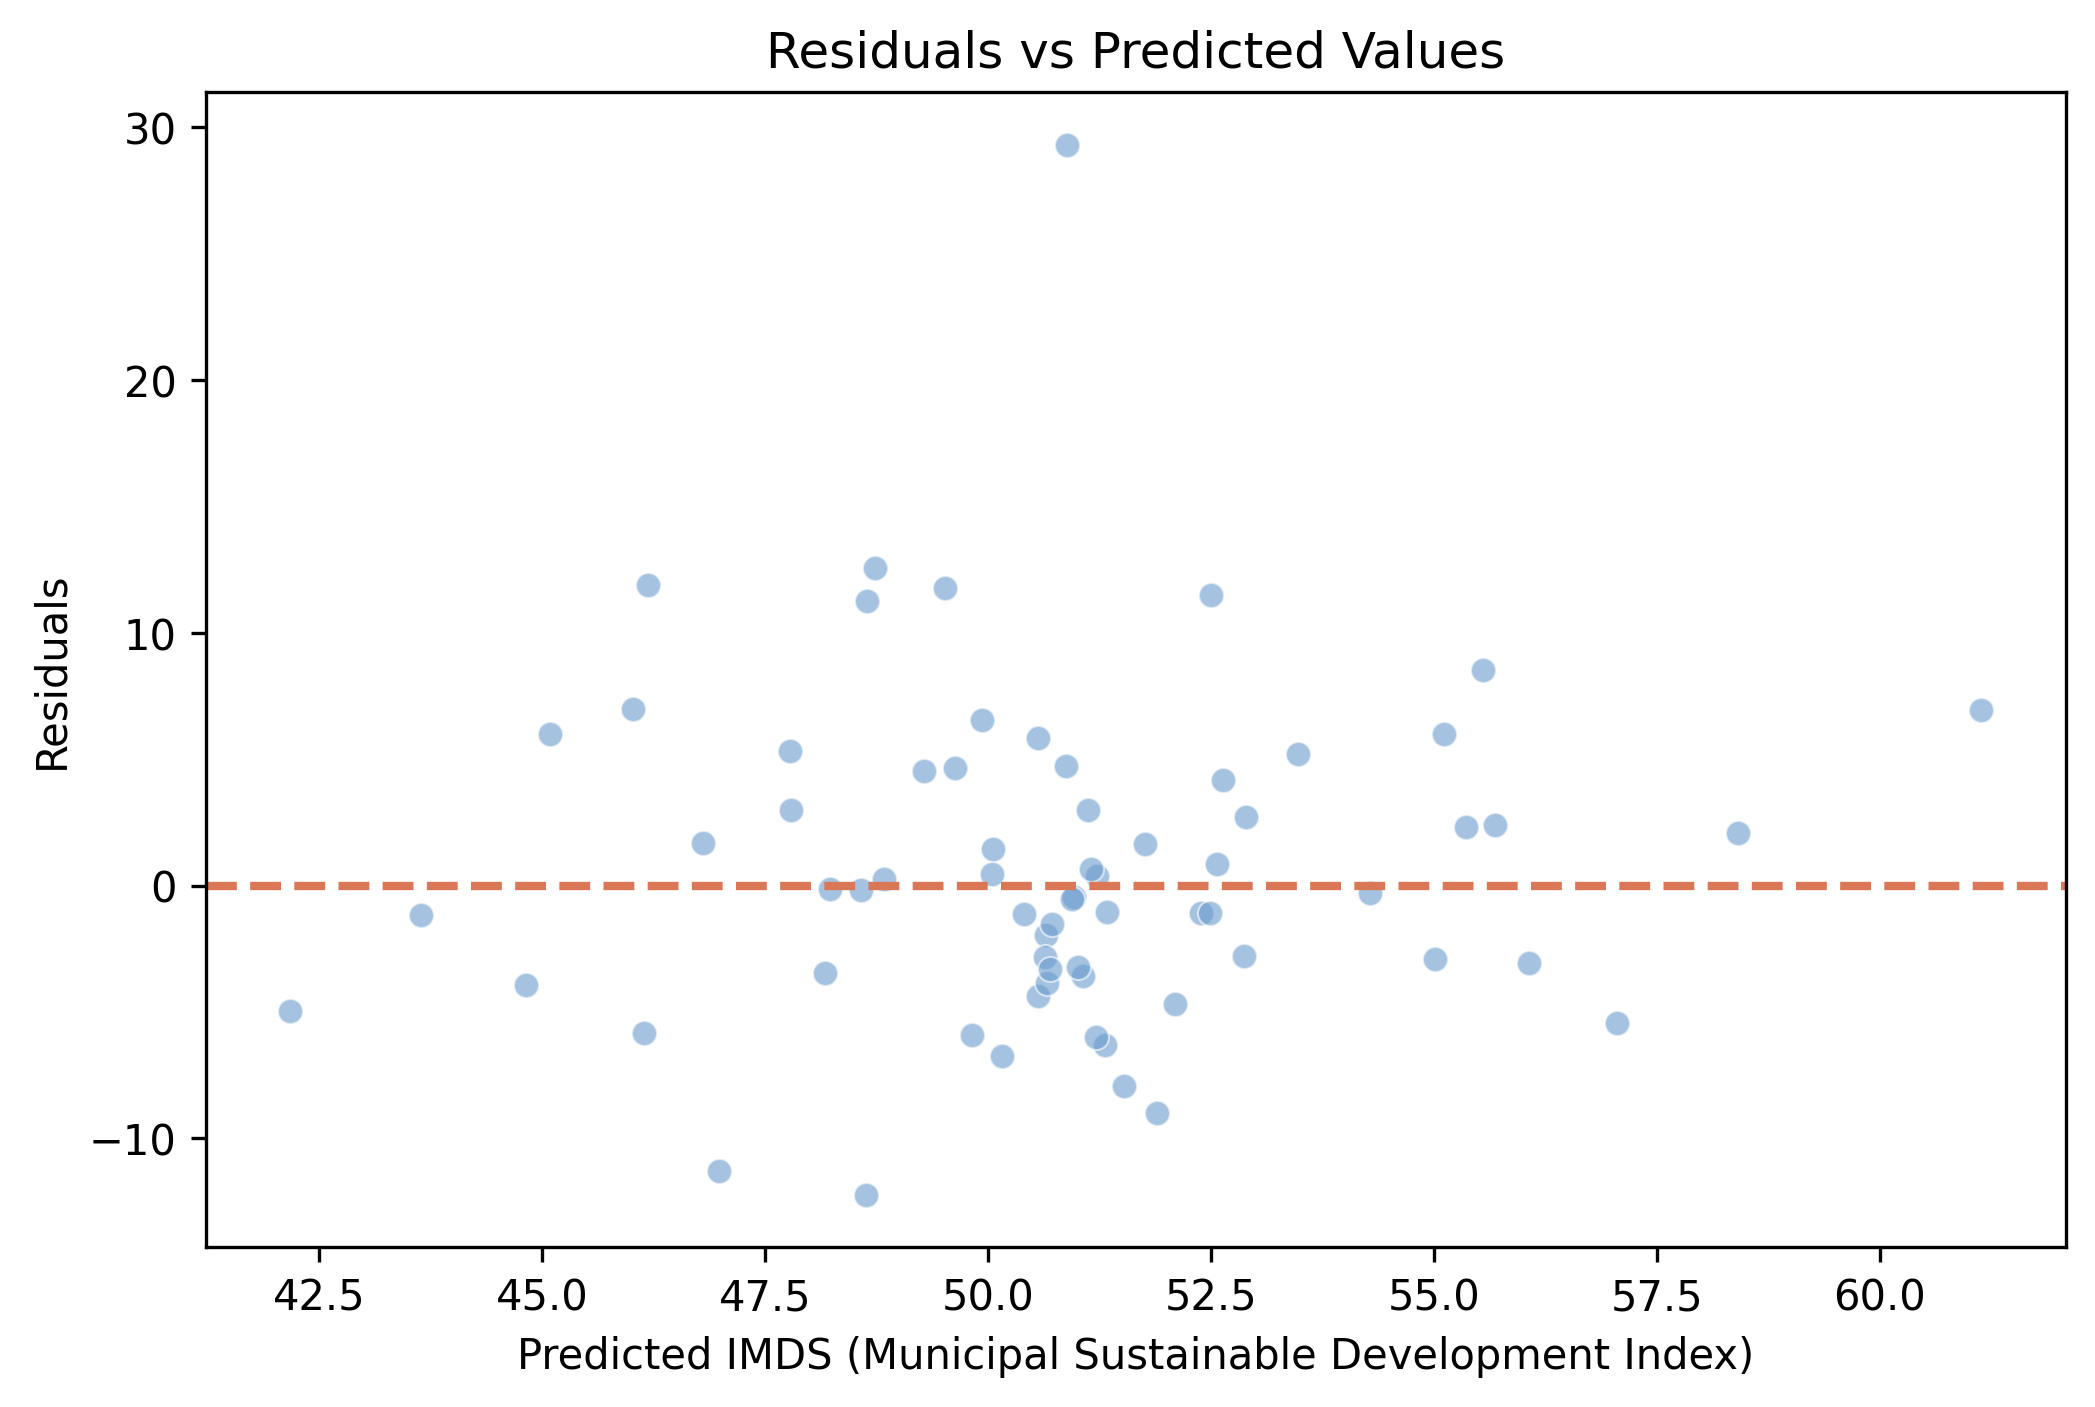
Out-of-fold residuals versus predicted IMDS, colored by fold: centered on zero but tilting up where the under-predicted big cities sit.

Does tuning rescue it? Grid, random, and Optuna all lift R-squared by < 0.03

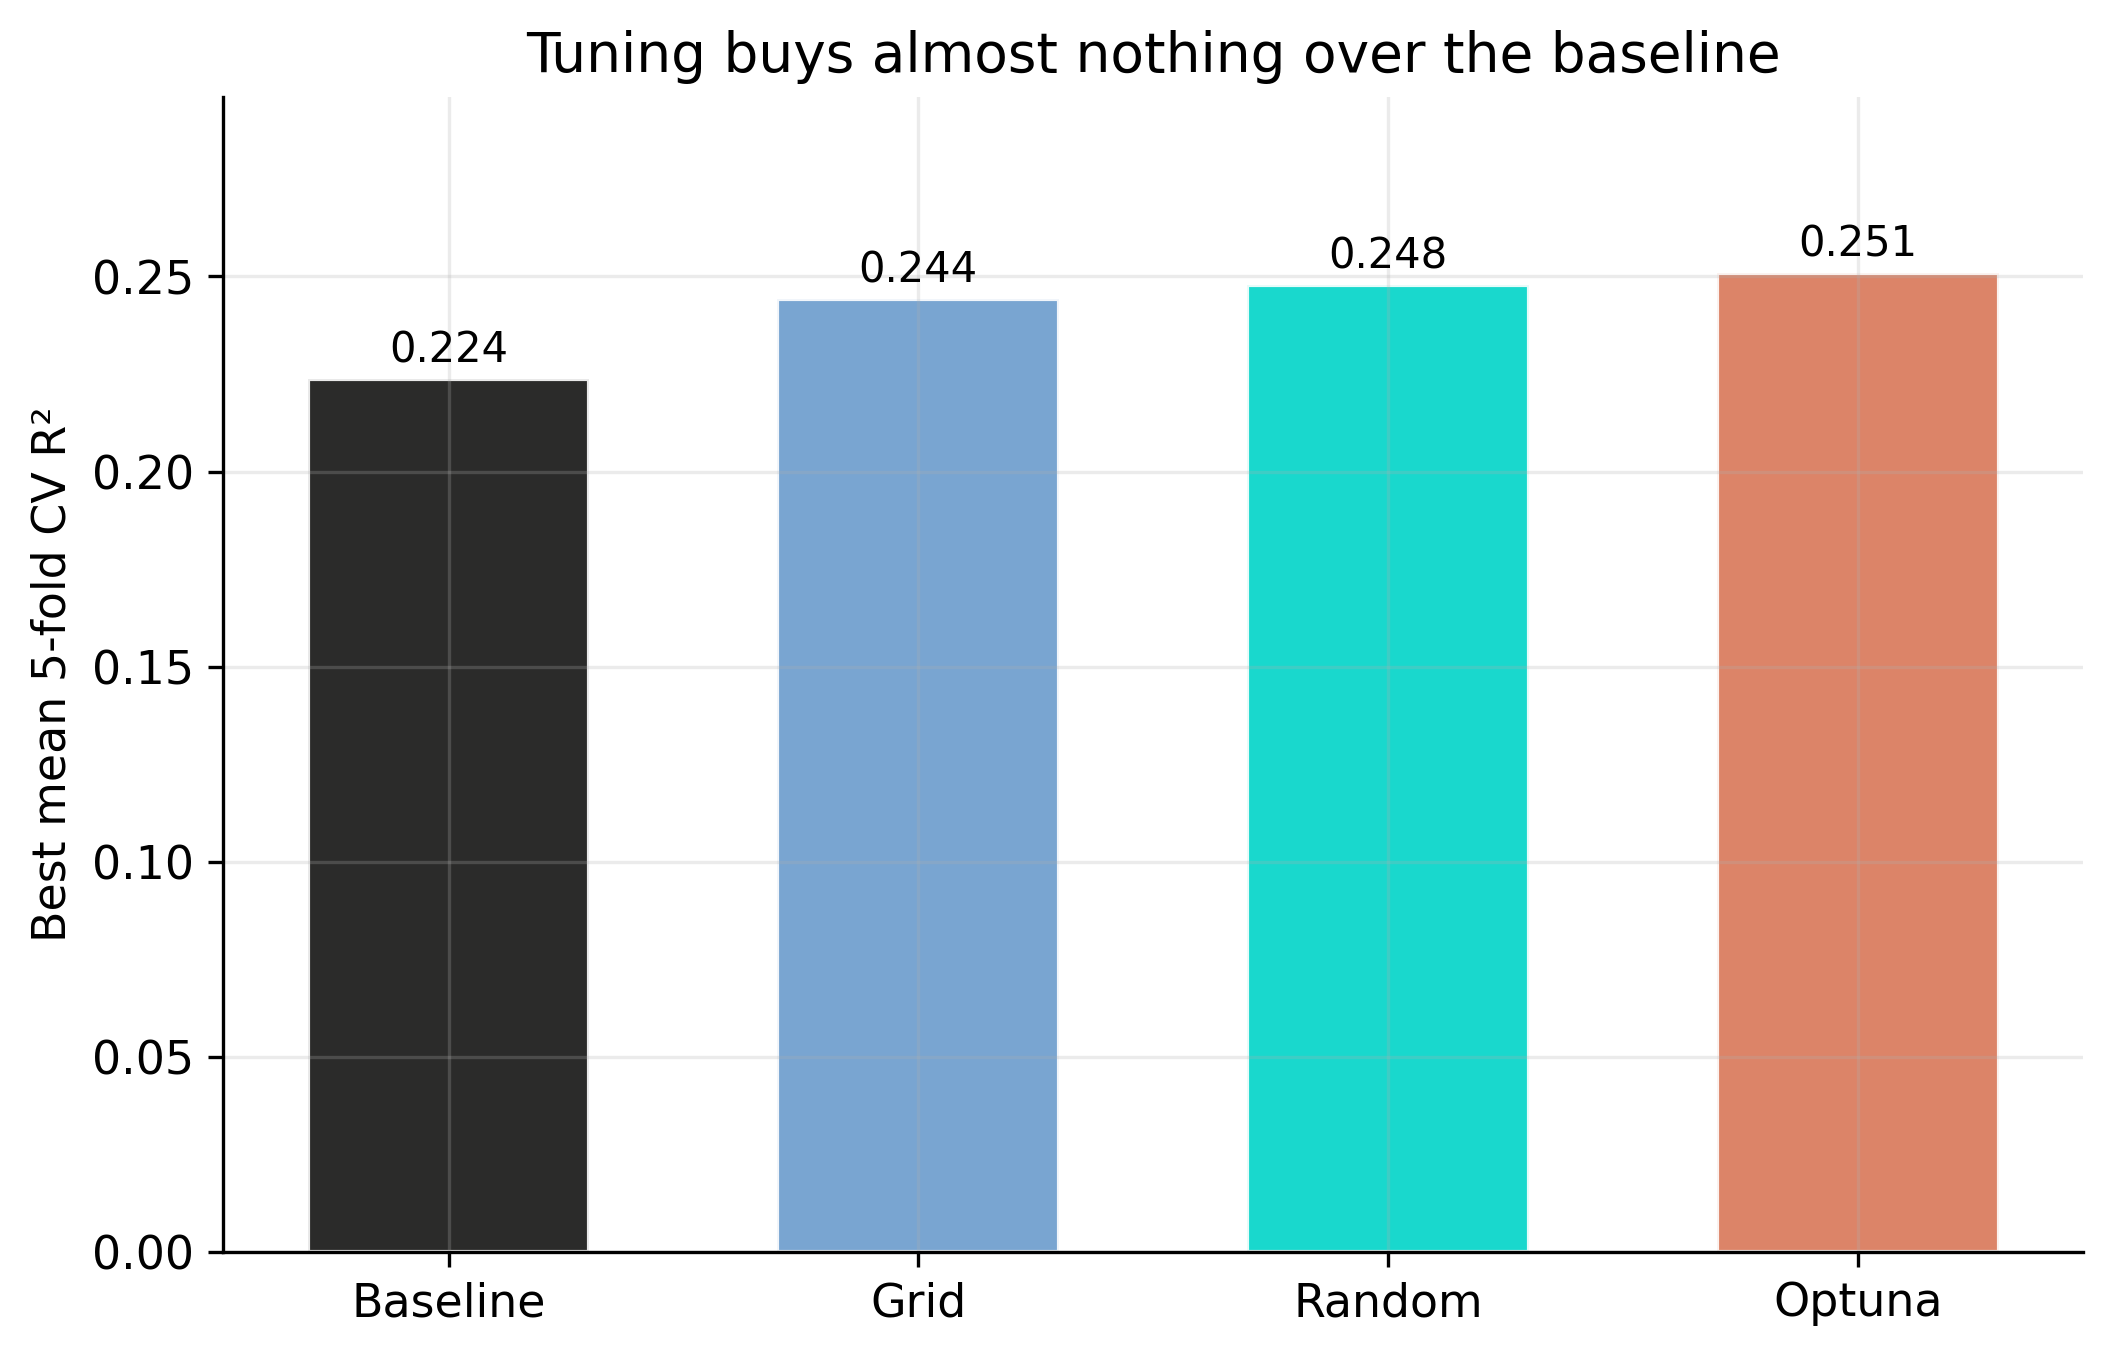
Best cross-validated R-squared: baseline vs grid search, random search, and Optuna (Appendix B).

The methods rank as theory predicts — Optuna ≥ random ≥ grid — but every gain is smaller than the 0.17 fold-to-fold noise.

Did the forest overfit? No — cross-validation is the proof

Objection. A Random Forest with deep trees on only 339 rows must be memorizing noise.

Response. Overfitting would make held-out performance collapse. Instead every fold is tested on towns it never trained on, and the pooled out-of-fold R-squared still sits at 0.22. The model is under-powered by the features, not over-fit to the rows.

The 78% it misses lives off-camera: pair the pixels with survey data

  • Governance, migration, and informal economies are invisible from orbit
  • Satellite embeddings are a genuine but partial proxy — a starting layer
  • Next experiment: fuse embeddings with administrative or survey covariates

Satellite pixels know the middle of the distribution — for the edges, you still need the survey.