High-Dimensional Fixed Effects Regression

From OLS to two-way FE, IV, and event studies in Python with PyFixest

18.3% → 7.8%union premium after worker FE
0.094education return recovered by CRE
0.605R-squared with one-way FE

Carlos Mendez

Nagoya University (GSID)

June 11, 2026

The Tension

Act I

Union members earn 18% more — but is that the union, or who joins it?

A simple regression says union-covered workers earn 18.3% more per hour.

But the workers who join unions may also be more able, more motivated, or sorted into better firms. How much of that 18% is the union — and how much is selection?

One control — worker fixed effects — cuts the union premium nearly in half

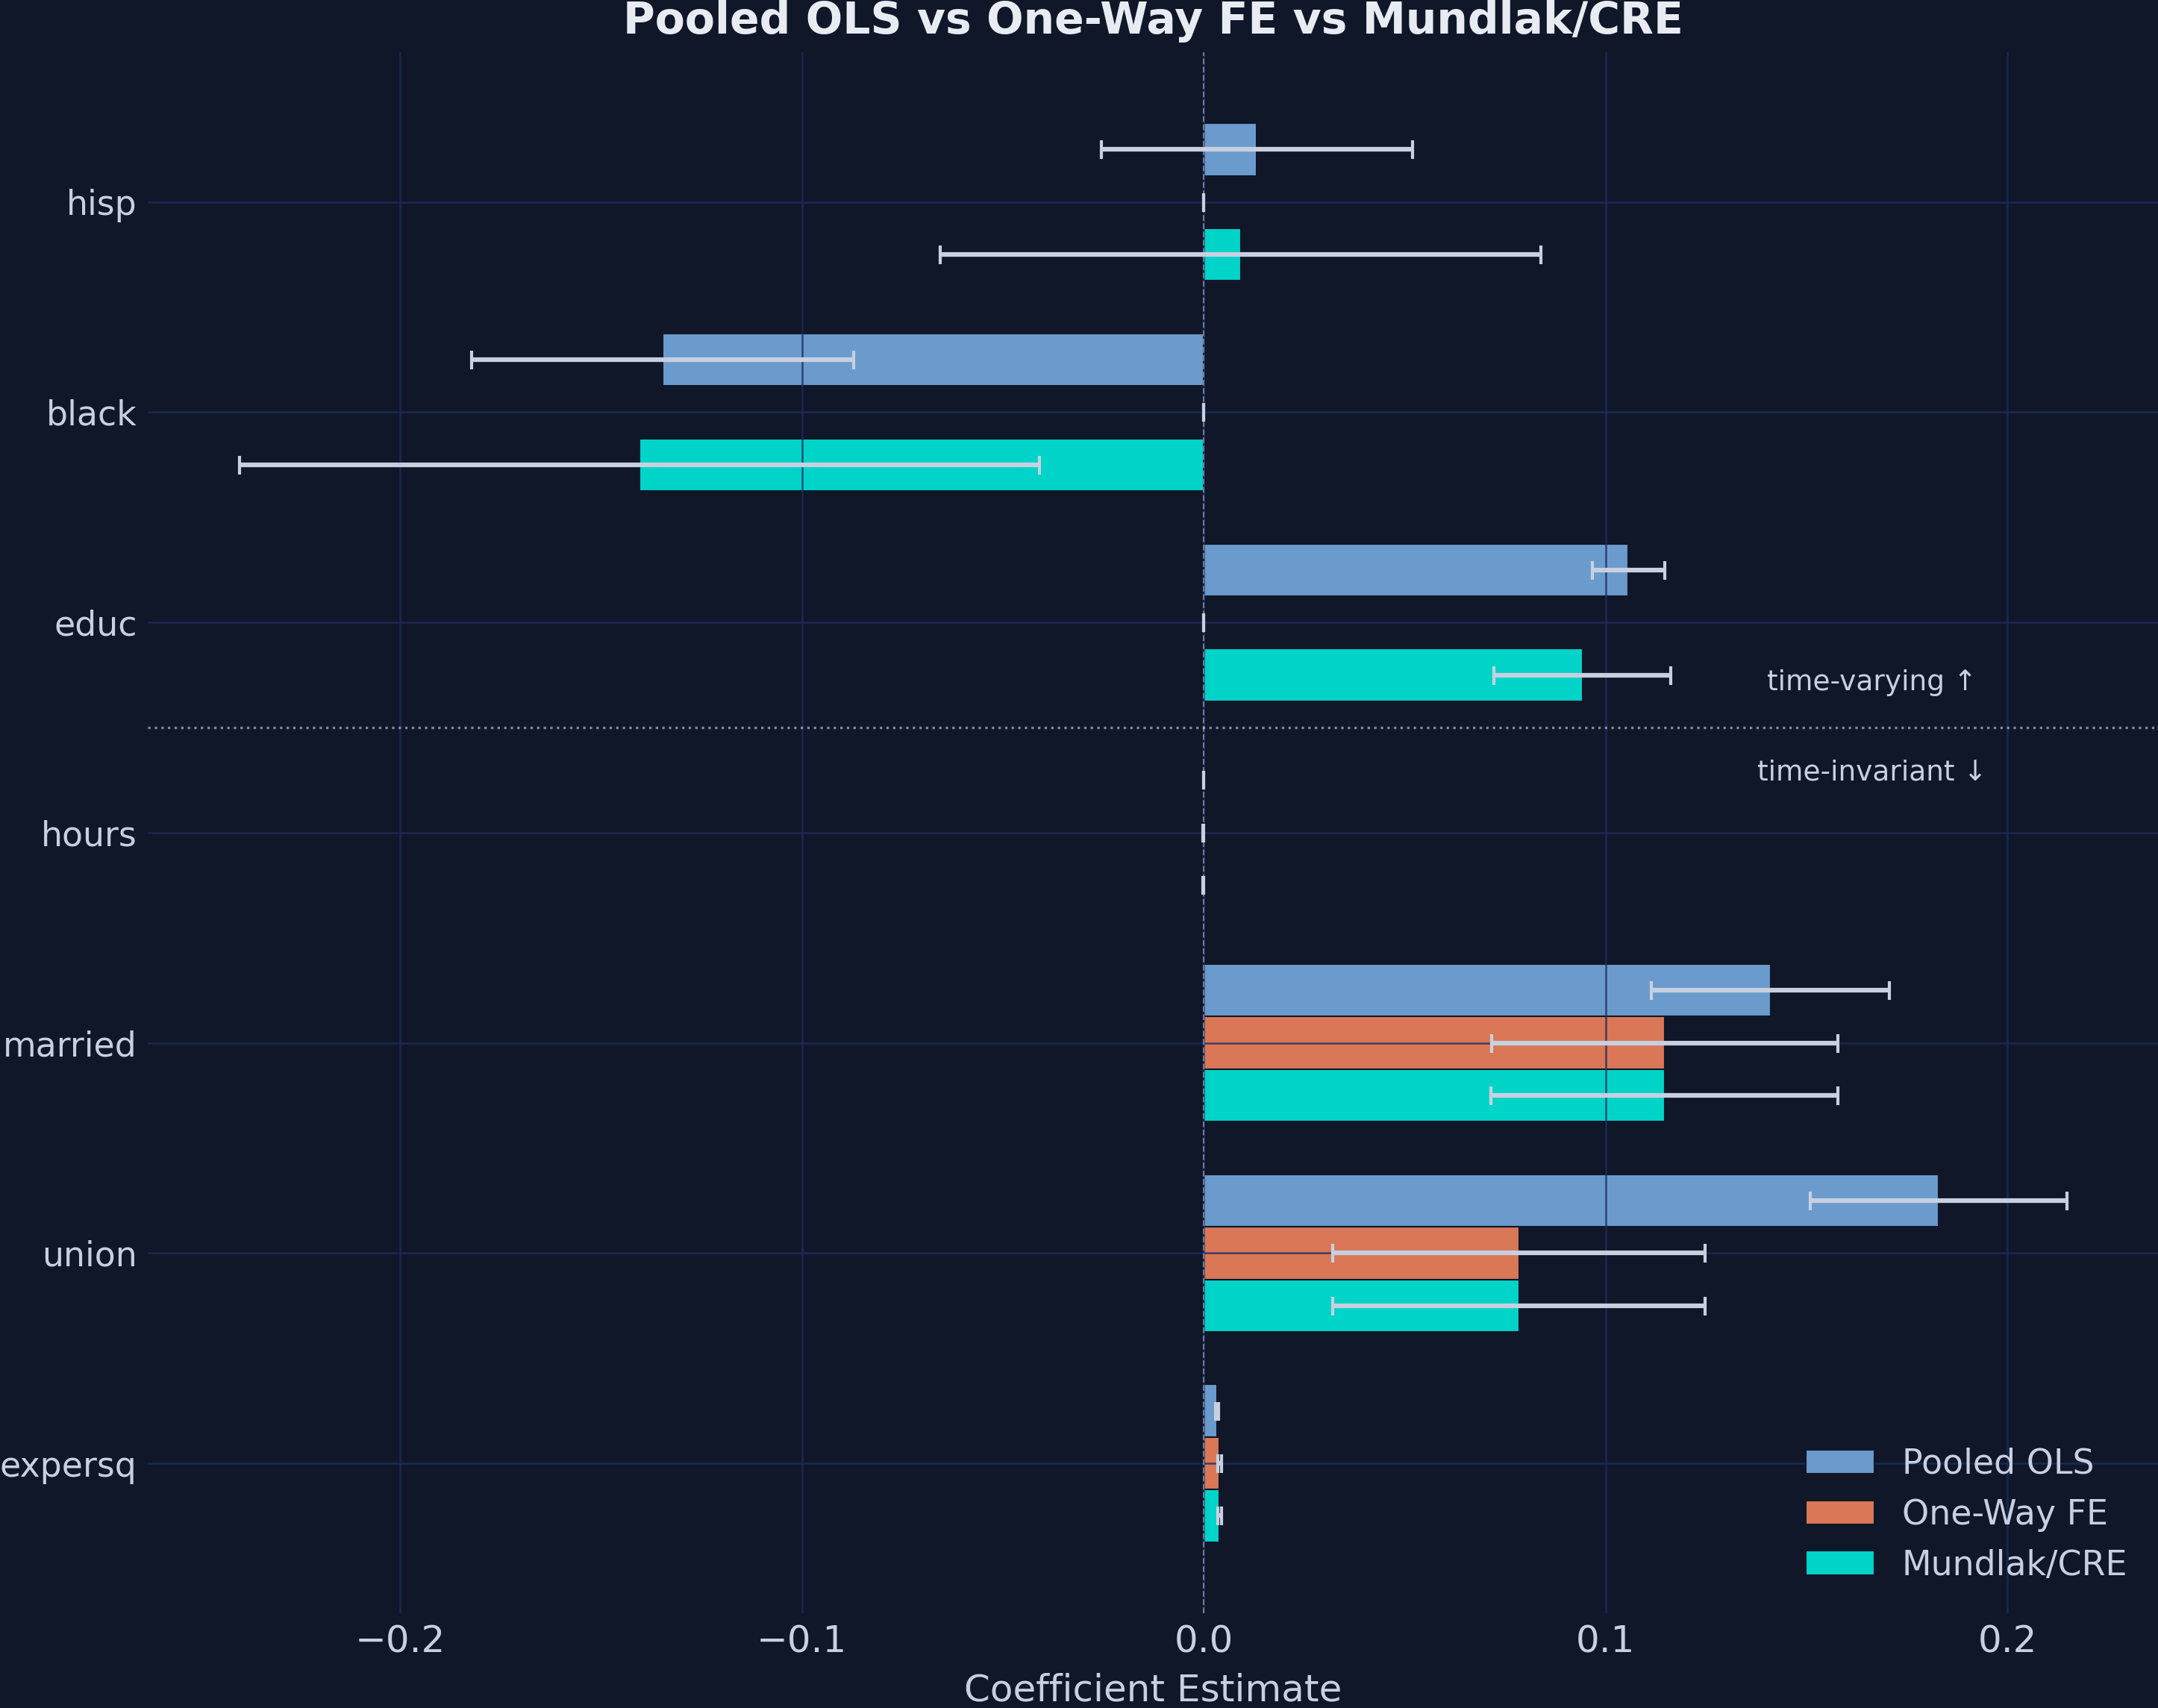
Pooled OLS vs One-Way FE vs CRE across seven covariates. The union bar collapses once worker fixed effects are absorbed.

Where we’re going

  • Why unobserved group heterogeneity biases OLS
  • Fixed effects as demeaning — the within transformation
  • Two-way FE, clustered standard errors, and IV
  • A real wage panel: the union premium and the CRE/Mundlak recovery
  • Event studies: when standard TWFE breaks down

The Investigation

Act II

Groups sit at different levels — that between-group gap is the confounder

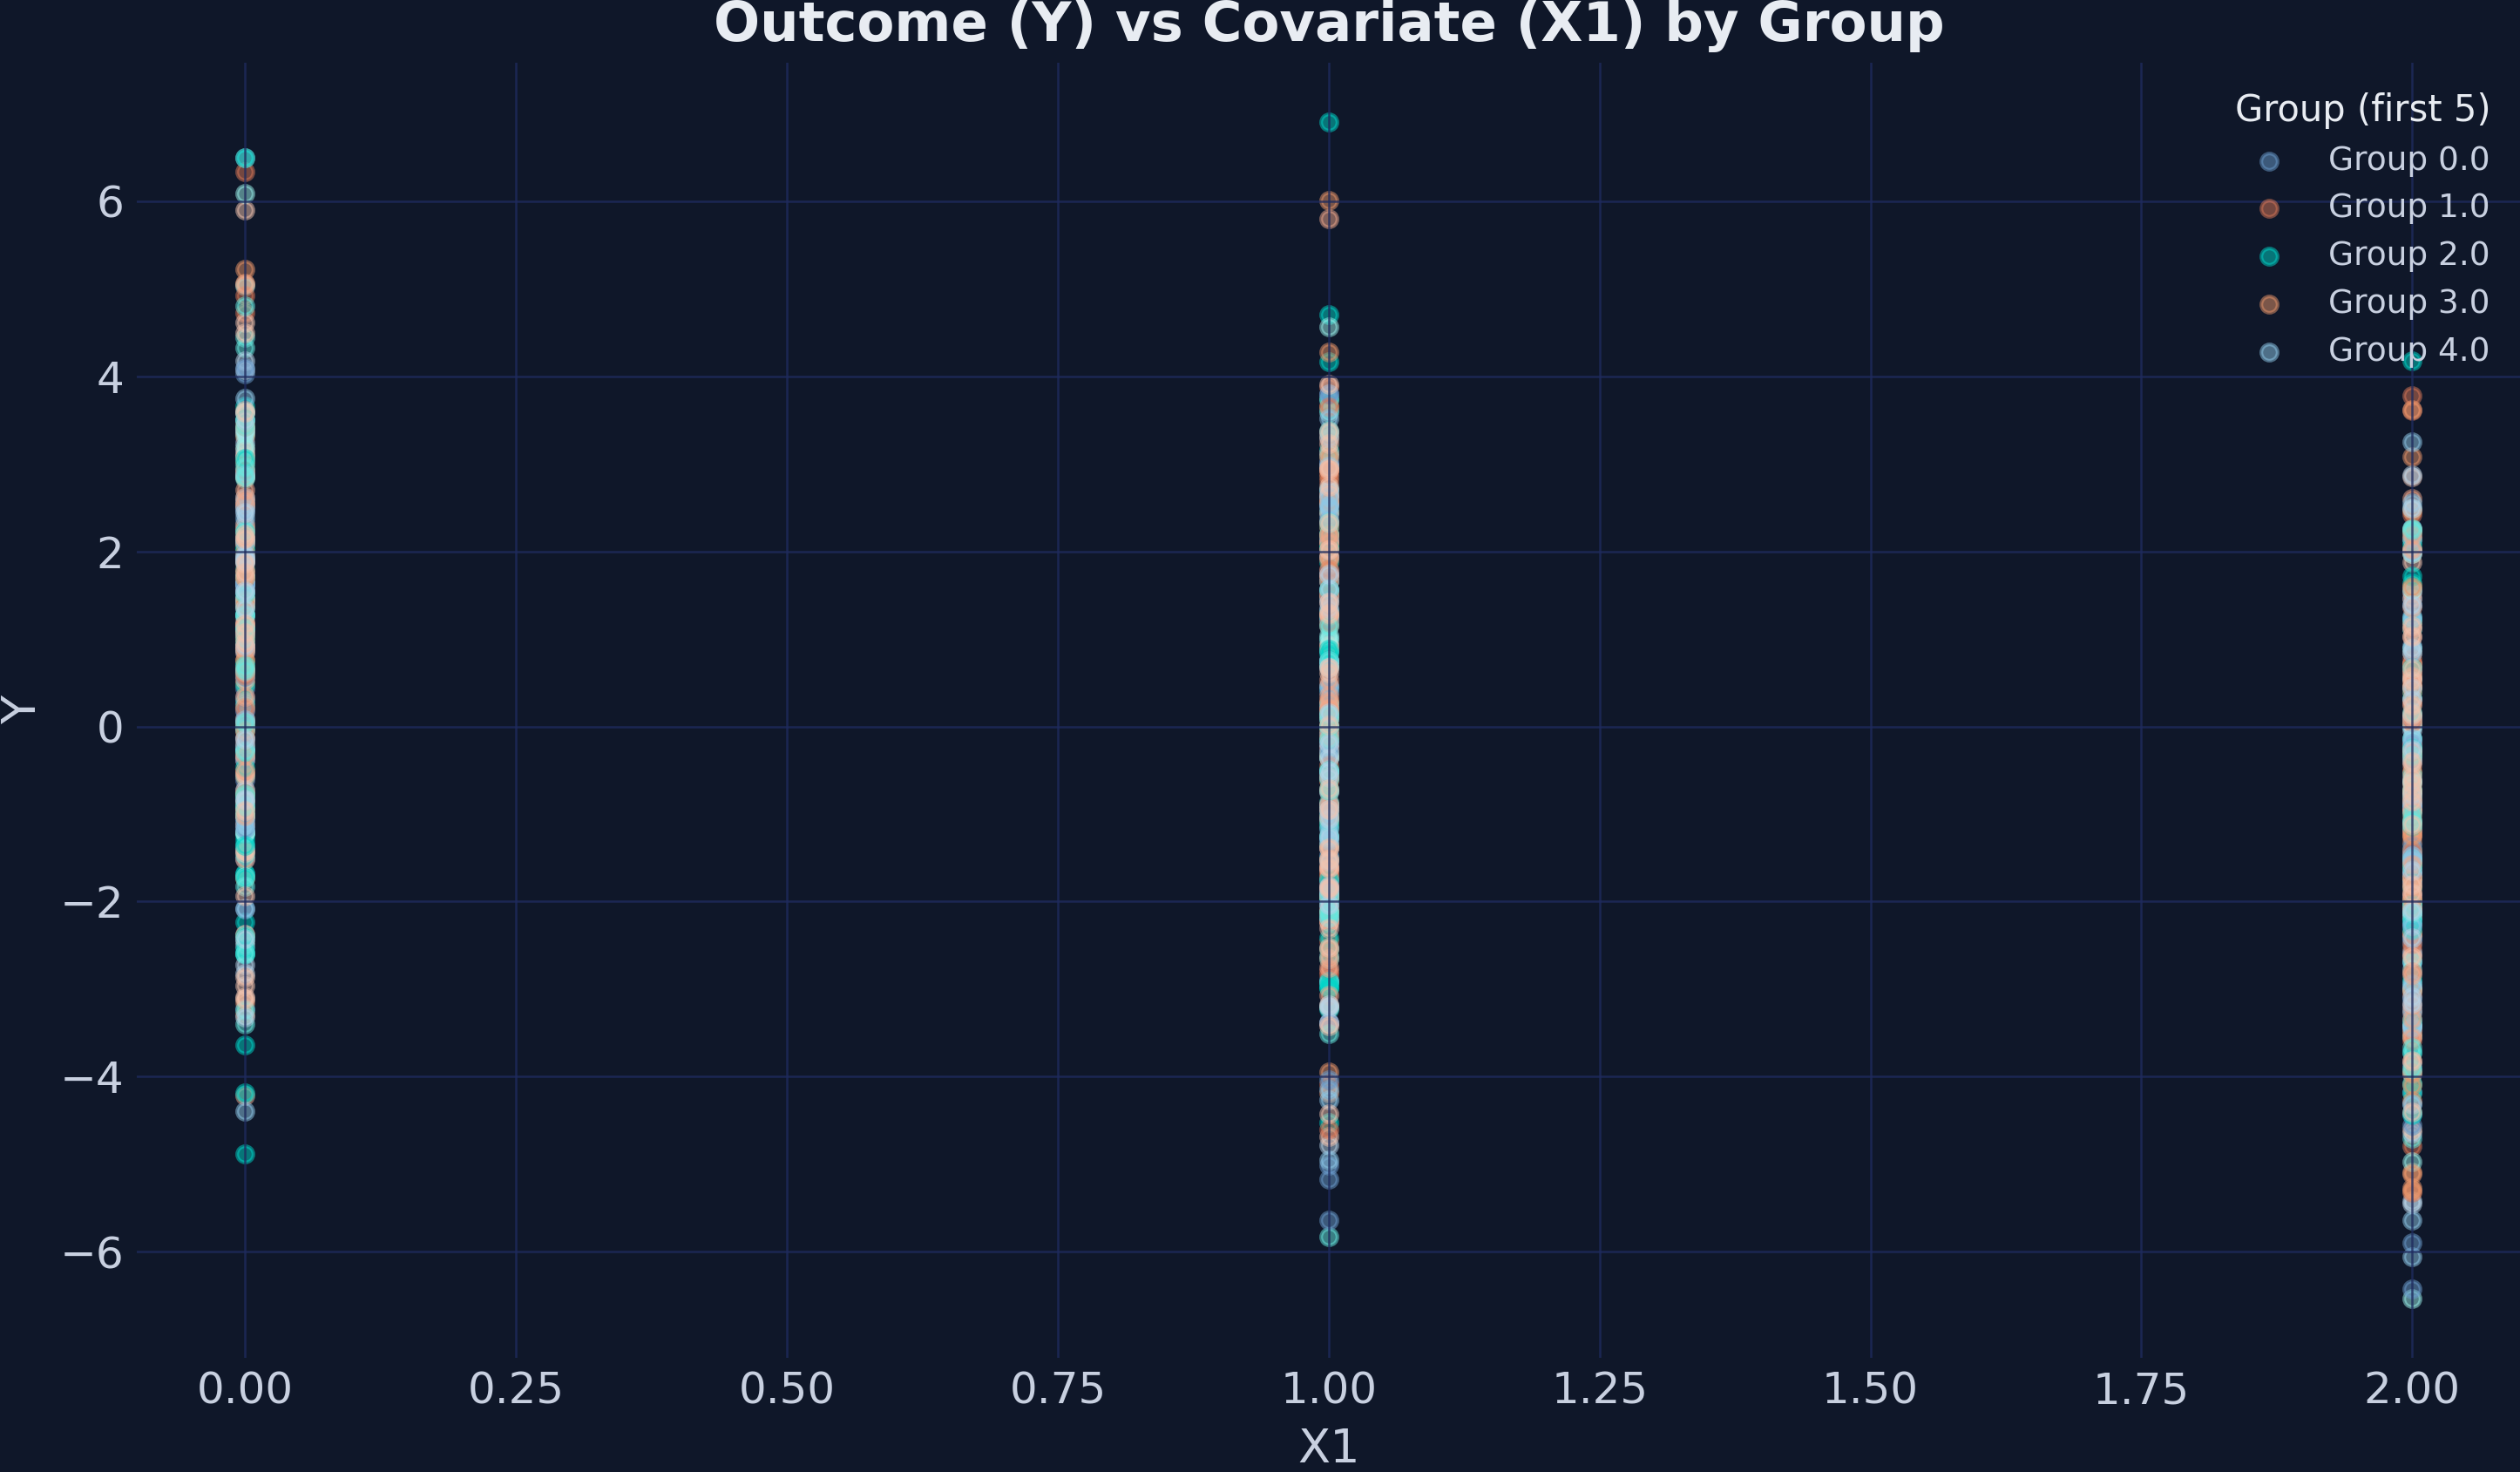
Outcome \(Y\) vs covariate \(X_1\), coloured by group. Clusters sit at different vertical levels.

A fixed effect is just one extra intercept per group

\[Y_{it} = \alpha_i + X_{it}\beta + u_{it}\]

Add a unit-specific intercept \(\alpha_i\) that absorbs every time-invariant characteristic of unit \(i\) — observed or not.

Block one entire class of confounders — innate ability, firm culture, institutional quality — in a single step.

Absorbing group FE is mathematically identical to demeaning

\[\hat{\beta}_{FE} = \left(\sum_{i} \ddot{X}_i' \ddot{X}_i\right)^{-1} \sum_{i} \ddot{X}_i' \ddot{Y}_i\]

where \(\ddot{X}_i = X_{it} - \bar{X}_i\) and \(\ddot{Y}_i = Y_{it} - \bar{Y}_i\) are demeaned within each group.

Subtract each group’s own average, then run plain OLS — that is all a fixed effect does.

Demeaning collapses scattered clusters onto one clean within-group slope

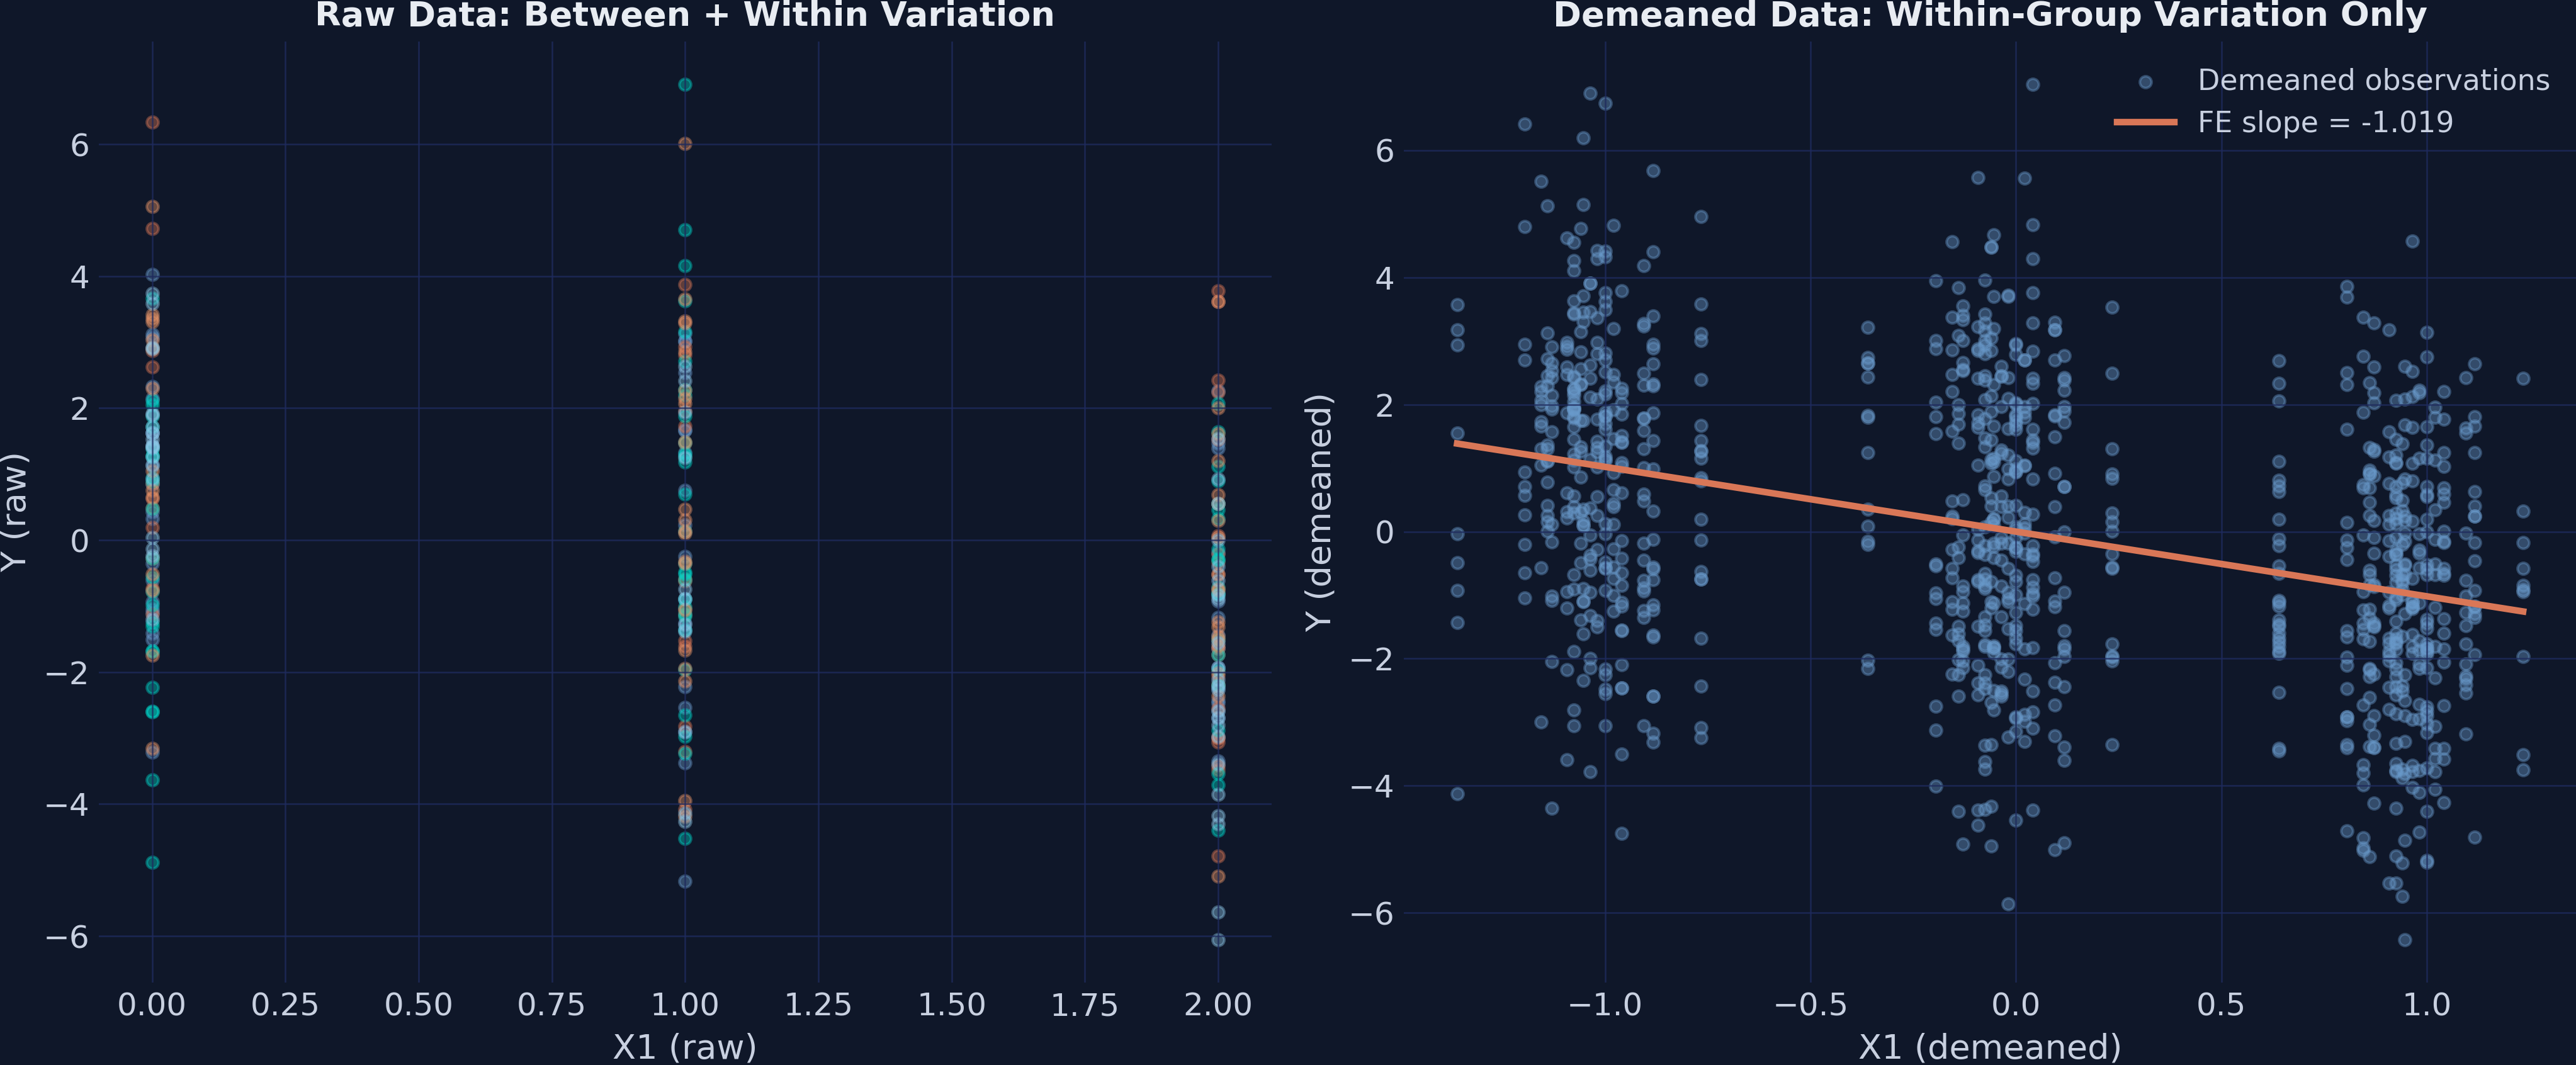
Raw data (left): clusters at different vertical levels. Demeaned data (right): centred on the origin, one negative slope of −1.019.

PyFixest absorbs high-dimensional FE with one pipe in the formula

import pyfixest as pf

fit_ols = pf.feols("Y ~ X1", data=data, vcov="HC1")            # no FE
fit_fe1 = pf.feols("Y ~ X1 | group_id", data=data, vcov="HC1") # one-way FE
fit_2w  = pf.feols("Y ~ X1 + X2 | f1 + f2", data=data)         # two-way FE
fit_iv  = pf.feols("Y2 ~ 1 | f1 + f2 | X1 ~ Z1 + Z2", data=data) # FE + IV

Adding fixed effects keeps the X1 effect near −1.0 as the CI narrows

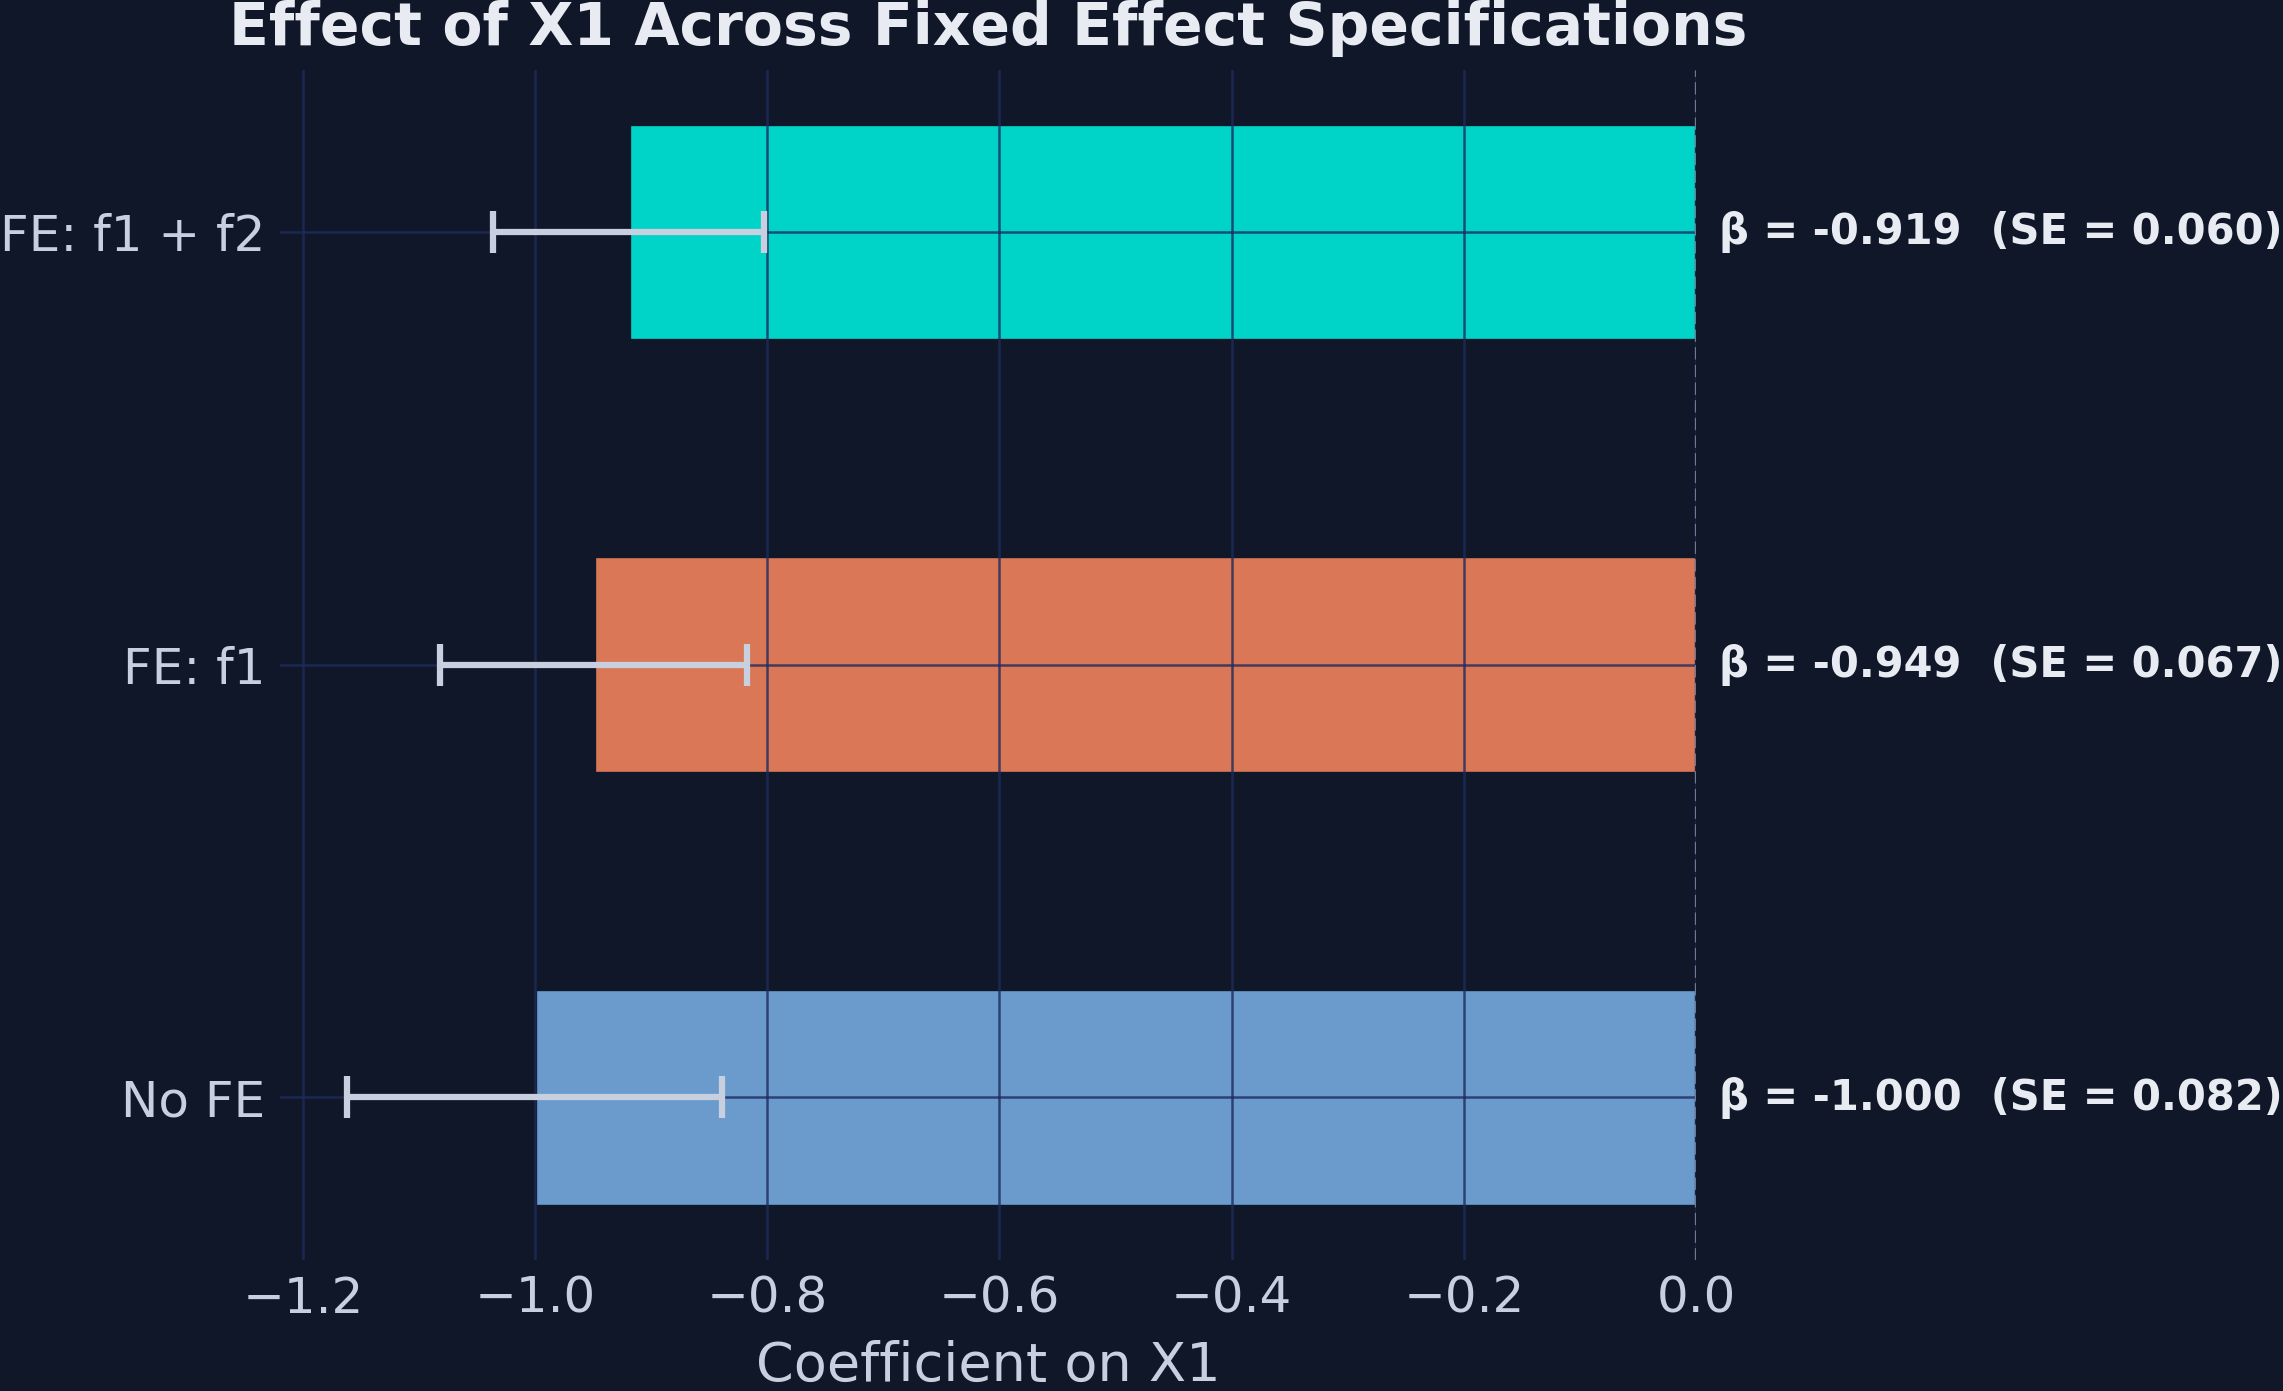
Coefficient on \(X_1\) across No FE, one-way, and two-way specifications — stable near \(-1.0\) as the CI narrows.

Clustering standard errors inflates the X1 SE by 50% — same point estimate

SE assumption SE(\(\hat\beta_{X_1}\)) \(t\)-stat
iid 0.0858 −11.9
HC1 (robust) 0.0833 −12.2
CRV1 (group) 0.1172 −8.7
CRV3 (group) 0.1247 −8.2

The estimate never moves; only honesty about uncertainty does.

IV through fixed effects recovers a strong first stage

\[\underbrace{X_1 = \pi_0 + \pi_1 Z_1 + \pi_2 Z_2 + \alpha_i + \gamma_t + \nu}_{\text{first stage}} \;\Rightarrow\; \underbrace{Y_2 = \beta\, \hat{X}_1 + \alpha_i + \gamma_t + \epsilon}_{\text{second stage}}\]

The IV estimate is \(-1.600\) (SE 0.336) vs OLS \(\approx -1.0\) — attenuation reversed; first-stage \(F = 311.54 \gg 10\).

The Resolution

Act III

The wage panel verdict: more than half the union premium was selection

Variable Pooled OLS One-Way FE
union 0.183 0.078
married 0.141 0.115
educ 0.106 dropped
black −0.135 dropped
R-squared 0.175 0.605

One worker intercept each: the union premium halves and \(R^2\) more than triples.

Worker fixed effects cut the union premium from 18.3% to 7.8%

7.8%

union premium under one-way worker FE (was 18.3% in pooled OLS; one-way FE SE 0.024)

Why education vanishes: its demeaned column is all zeros

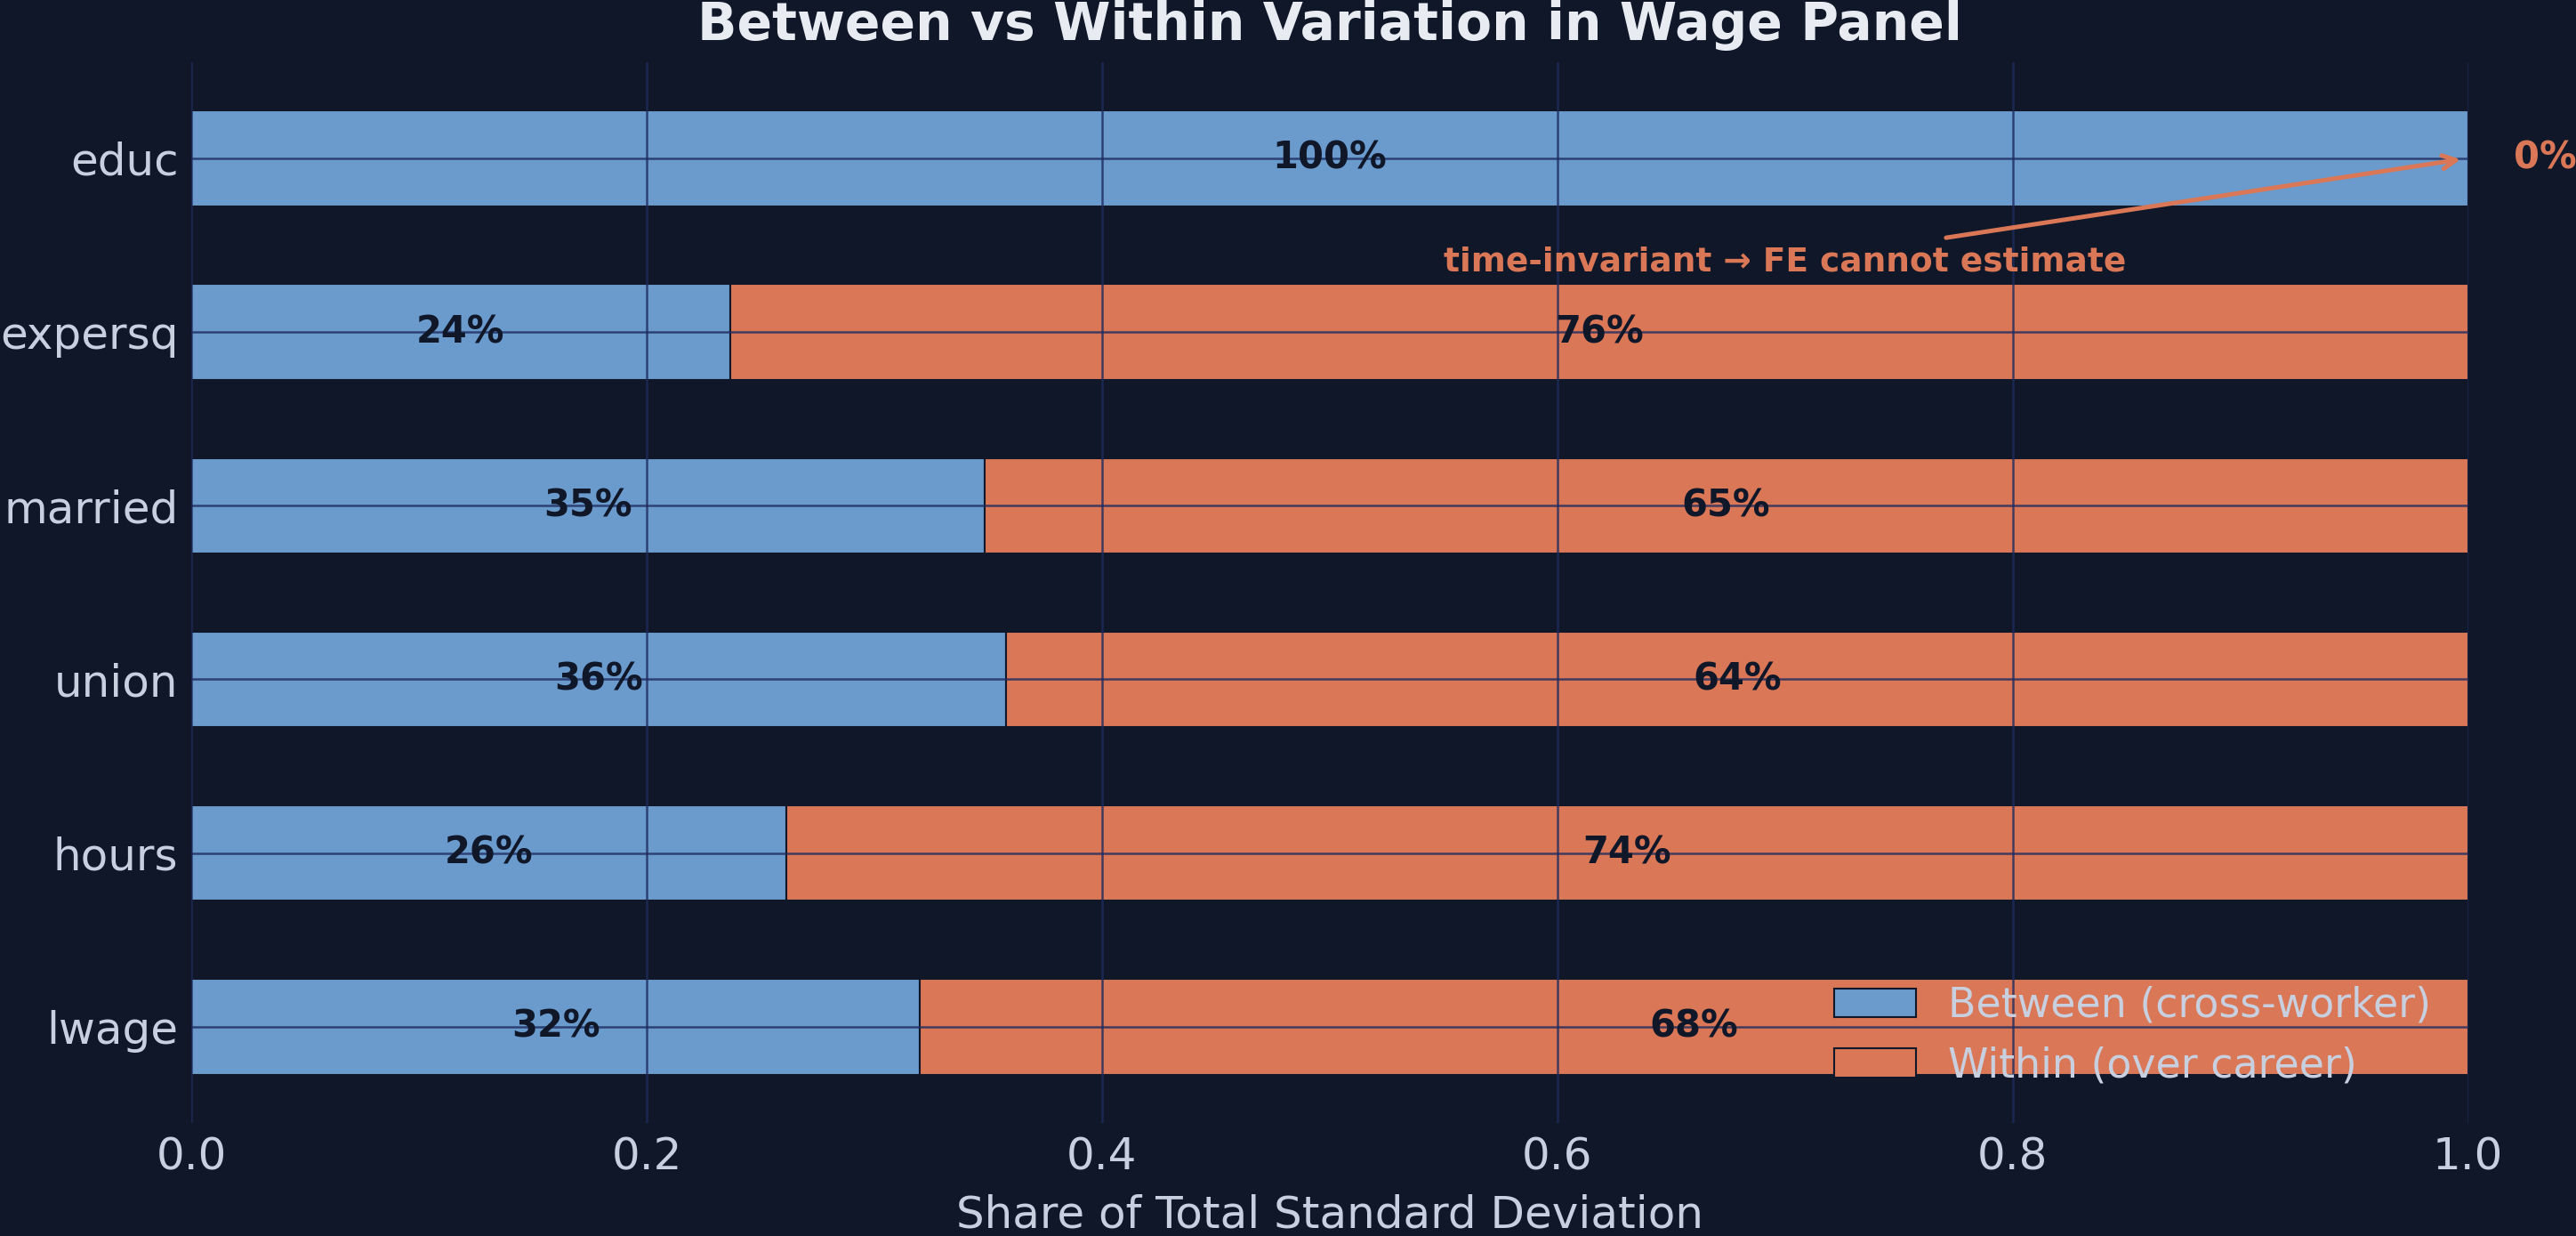
Within vs between share of variation. Education is 100% between-worker — zero within variation.

\[\ddot{educ}_{it} = educ_i - \bar{educ}_i = 0 \quad \text{for all } t\]

CRE swaps entity dummies for career averages and buys education back

\[\ln(wage_{it}) = \beta X_{it} + \gamma Z_i + \pi \bar{X}_i + \epsilon_{it}\]

Replace 545 worker dummies with each worker’s career averages \(\bar{X}_i\).

Time-varying \(\hat\beta\) still match one-way FE; the time-invariant \(\gamma\) become estimable again.

More FE dimensions barely move anything — the action was one-way FE

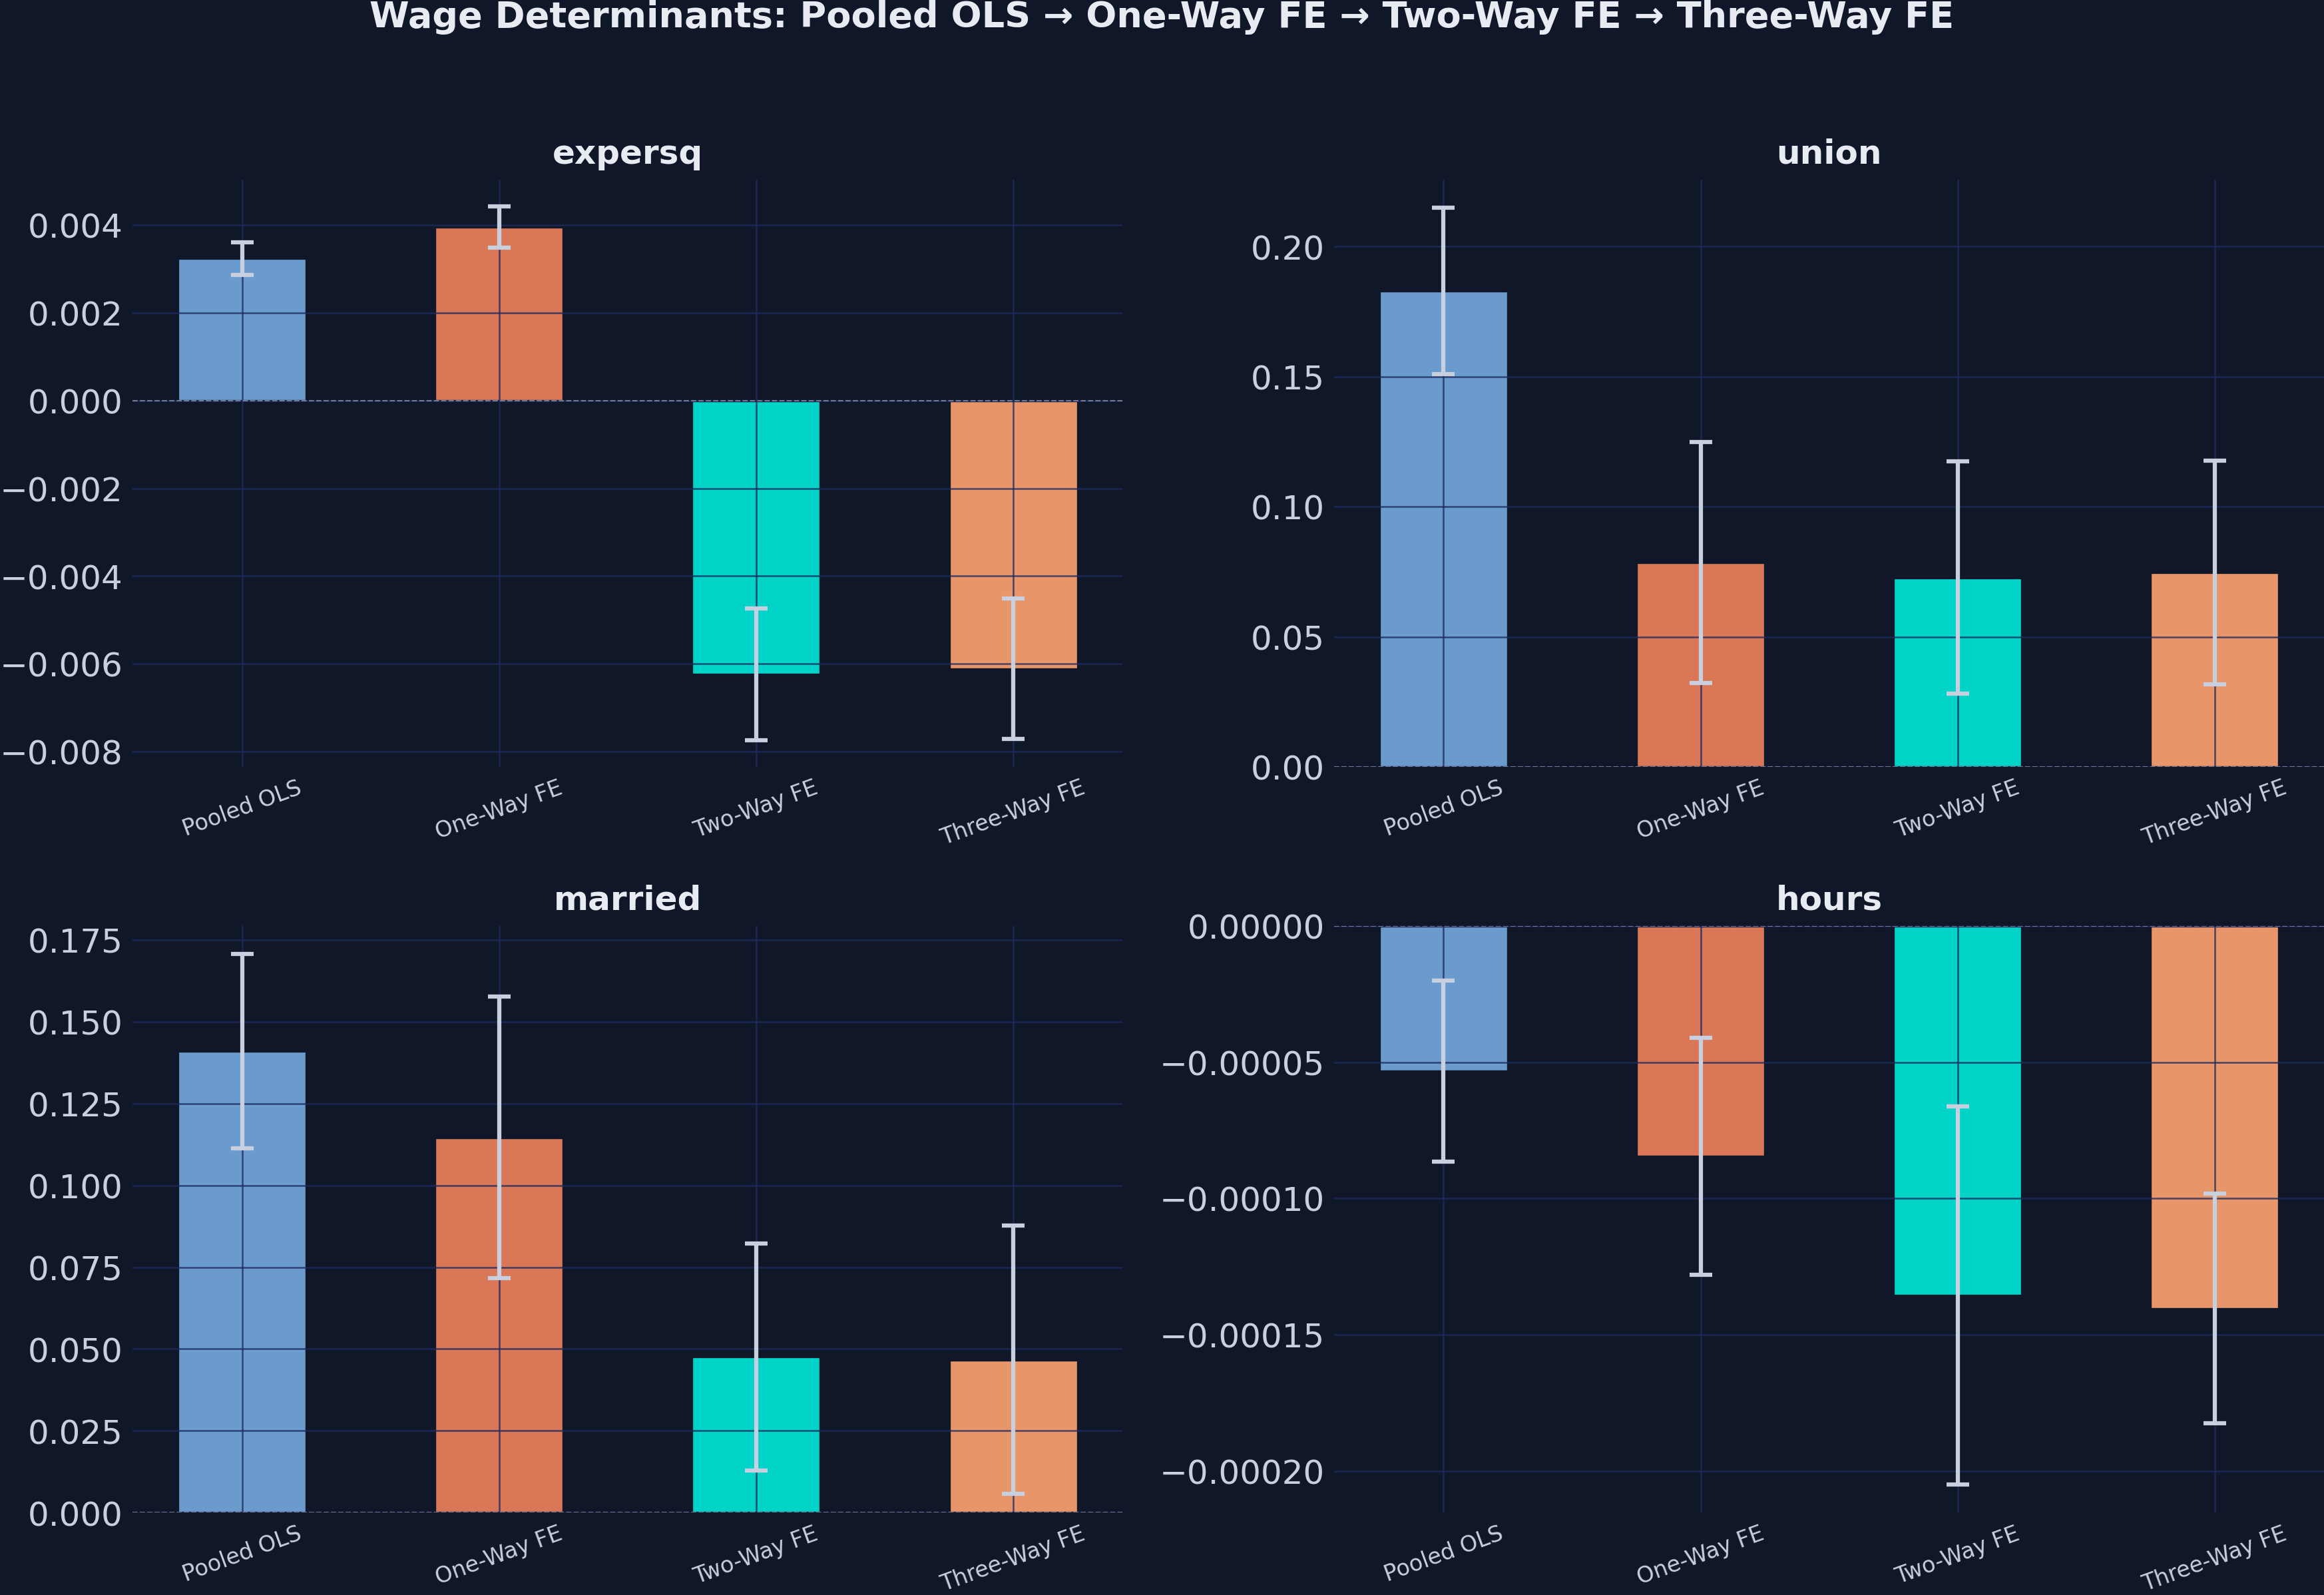
Coefficients across pooled OLS, one-way, two-way, and three-way FE. The big jump is one-way; later dimensions are flat.

TWFE event studies overstate the effect under staggered adoption

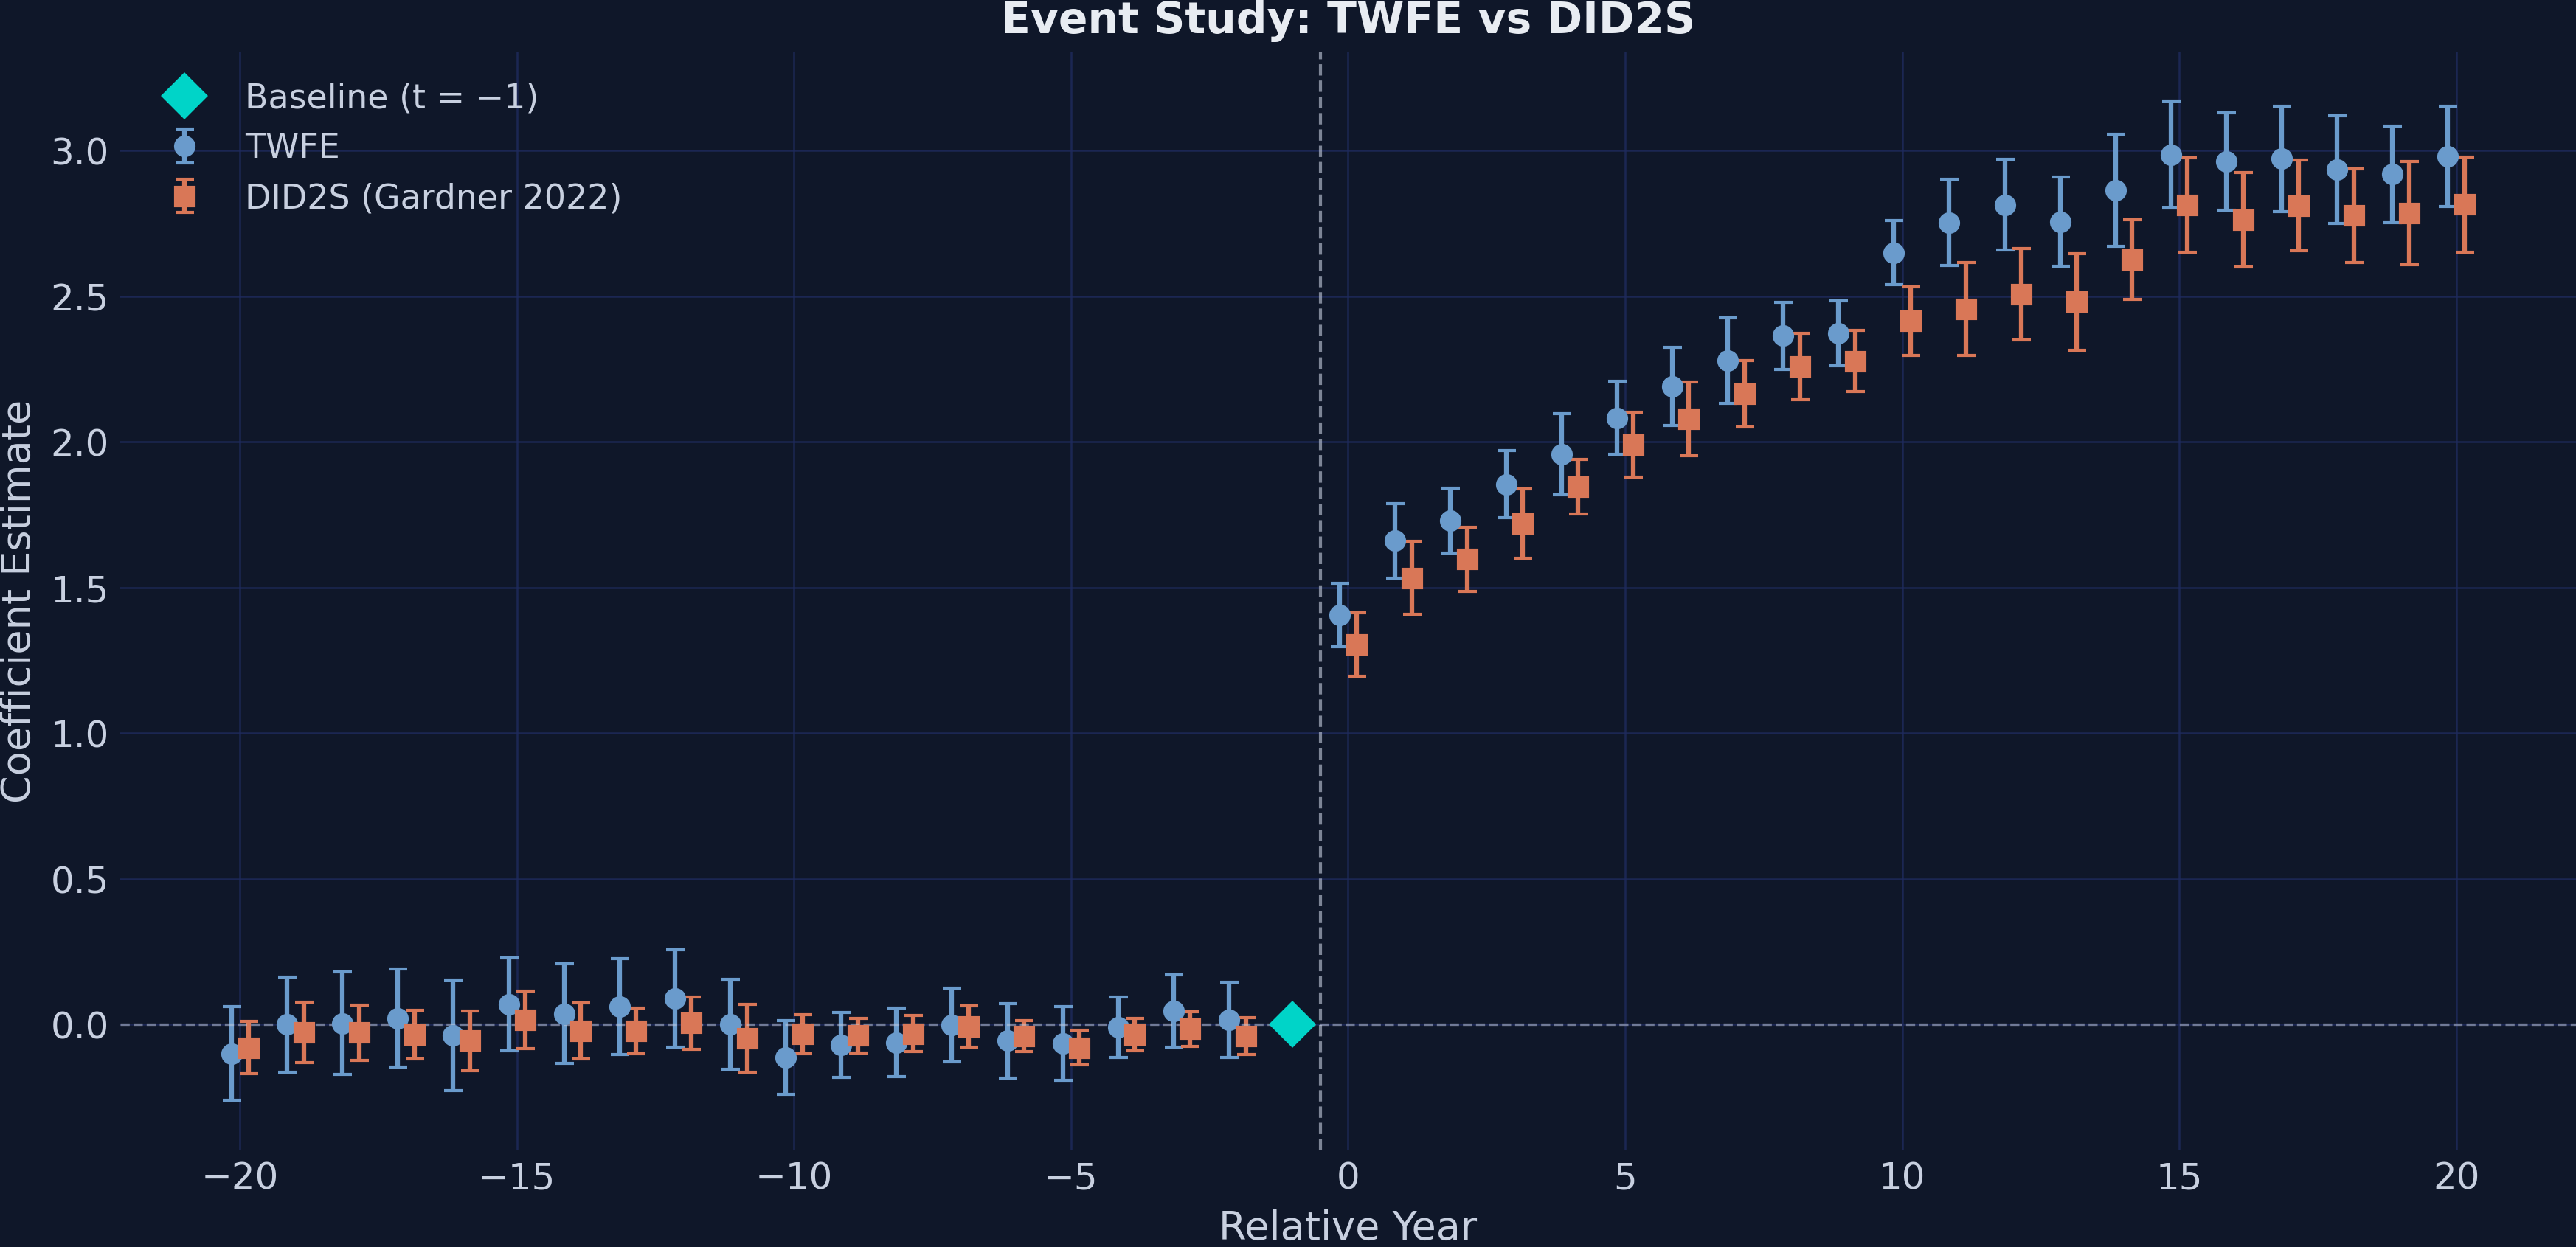
Event study: flat pre-trends, sharp jump at treatment, TWFE (blue) sits above DID2S (orange) post-treatment.

Does FE make this causal? No — it removes one class of confounder, not all

Objection. Fixed effects look like a clean experiment — surely 7.8% is the causal union effect.

Response. FE only removes time-invariant confounders. A worker whose ability changes with union status, or reverse causality, still biases \(\hat\beta\). CRE adds an even stronger assumption. Identification rests on no time-varying confounding — not on the absorber itself.

Let the data’s within-group variation, not its levels, identify the effect.